
Fig. 4. mPER1 immunoreactivity in whole brain in mice of different group (mean±S.E.M.).
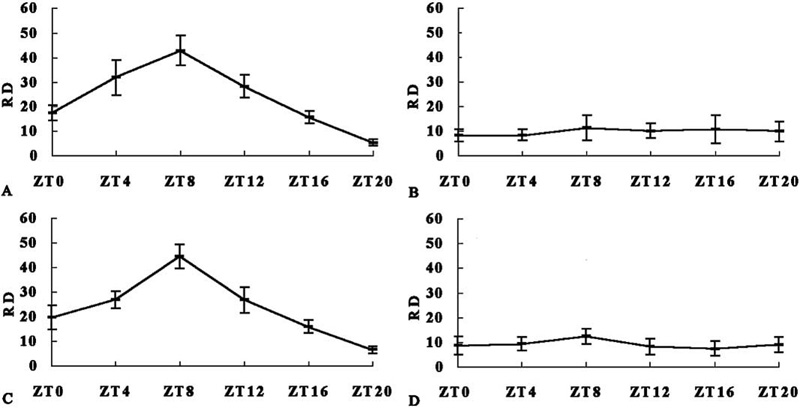
The relative density of mPER1 immunoreactivity (RD) was normalized against that of actin. Two-way ANOVA displayed that RD was different in groups and time points (intercept, F(1,87)=557.279, P<0.001; group, F(3,87)=32.775, P<0.001; time, F(5,87)=15.394, P<0.001). (A) CMS. One-way ANOVA revealed a significant daily rhythm (F(5,18)=34.516, P<0.001). The maximum of mPER1 immunoreactivity was at ZT8 (ZT8–ZT4: P=0.031; ZT8–ZT12: P=0.003; ZT8–ZT16: P<0.001; ZT8–ZT20: P<0.001; ZT8–ZT0: P<0.001), and the minimum was at ZT20 (ZT20–ZT4: P<0.001; ZT20–ZT8: P<0.001; ZT20–ZT12: P<0.001; ZT20–ZT16: P=0.05; ZT20–ZT0: P=0.001). (B) DMS. One-way ANOVA revealed a non-significant daily rhythm (F(5,18)=0.421, P=0.828). (C) CMA. One-way ANOVA revealed a significant daily rhythm (F(5,18)=33.109, P<0.001). The maximum of mPER1 immunoreactivity was at ZT8 (ZT8–ZT4: P=0.002; ZT8–ZT12: P=0.002; ZT8–ZT16: P<0.001; ZT8–ZT20: P<0.001; ZT8–ZT0: P<0.001), and the minimum was at ZT20 (ZT20–ZT4: P<0.001; ZT20–ZT8: P<0.001; ZT20–ZT12: P<0.001; ZT20–ZT16: P=0.037; ZT20–ZT0: P=0.003). (D) DMA. One-way ANOVA revealed a non-significant daily rhythm (F(5,18)=1.157, P=0.368).