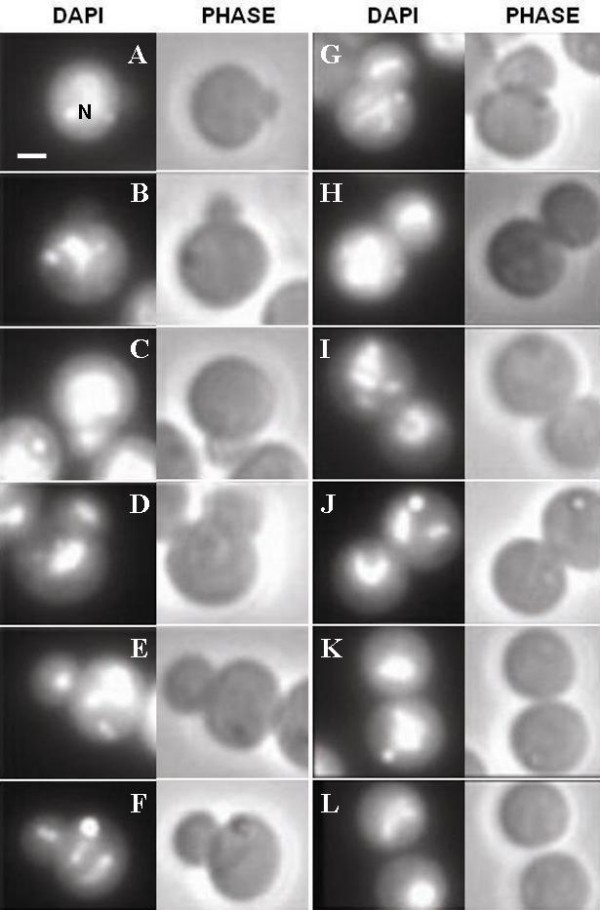
Figure 2.

Fluorescence and phase contrast micrographs of individual G. obscuriglobus budding cells. Each pair of micrographs (DAPI and PHASE) represents a different budding stage seen after staining with DAPI and visualizing via fluorescence and phase contrast microscopy, and each letter A-L refers to a paired micrograph (DAPI-stained on the left and PHASE microscopy on the right) of a different cell in each case. Nucleoid (N) DNA is stained with DAPI. Pair A represents the earliest budding stage while pair L represents the final stage. Bar – 1 μm.
