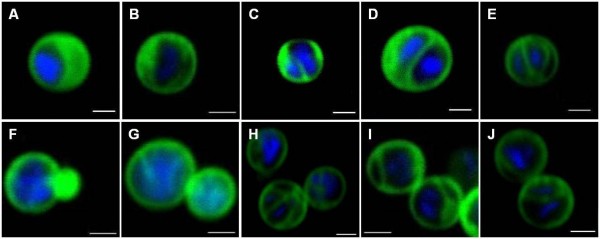
Figure 3.
Confocal laser scanning micrographs of individual G. obscuriglobus budding cells stained with DAPI and DiOC6. Each micrograph (A-J) represents either example of different appearances of cells before budding or different stages of budding. Frames (A-E) represent cells without buds (interpreted as cells seen before budding), frame (F) represents the earliest budding stage, frames (G-I) later stages of more mature buds and frame (J) the final stage. Blue – DAPI, Green – DiOC6, Bar – 1 μm.

