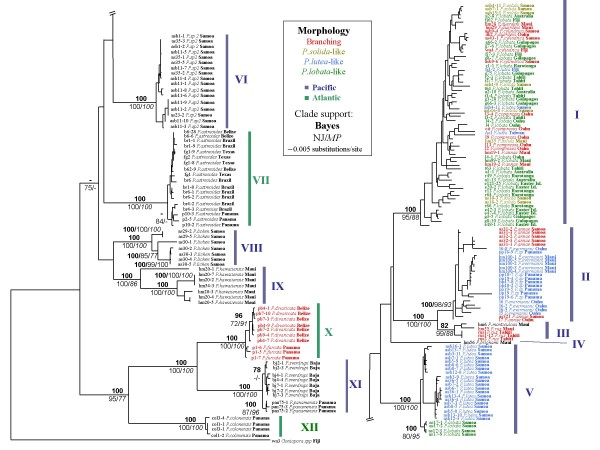
Figure 1.
Bayesian phylogenetic tree of the ITS data set. The sample identification code is followed by a dash and a clone number for cloned sequences; redundant sequences within an individual have been removed. Blue lines represent Pacific taxa and green lines represent Atlantic taxa. Colonies with branching morphology are highlighted in red. Specimens that were identified as P. solida, P. lutea and P. lobata are highlighted in light green, blue, and green respectively. Numbers above each node represent Bayesian posterior probability values; below left are NJ bootstrap values, below right are MP bootstrap values. Clade support values below 70, or those that do not include all molecular clones from an individual, are not shown.

