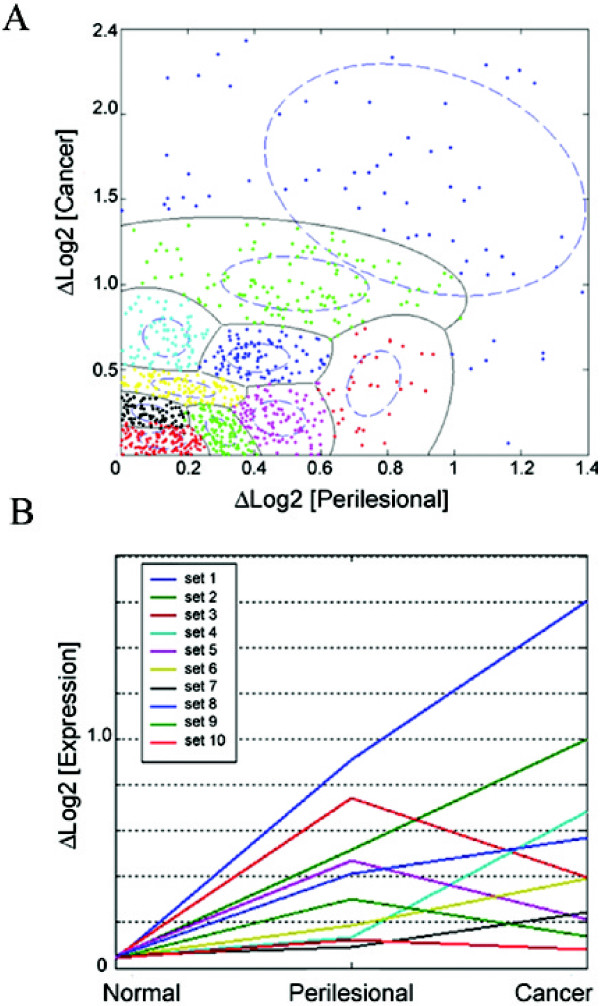
Figure 2.
Bayesian classification algorithm partitioned the genes into 10 subsets based on expression change patterns. Scatter plot of the change in log2 expression of Cancer from Normal, versus Perilesional from Normal, depicts the 10 possible subsets of genes differentiating the two groups. Subsets 1 and 2 displayed the best predictive value during validation.(A) Line plot of log2 expression of the 10 subsets, for the average change of Log2 expression of from Normal; for Normal, Perilesional and Cancer for each subset.(B).

