
Figure 5.
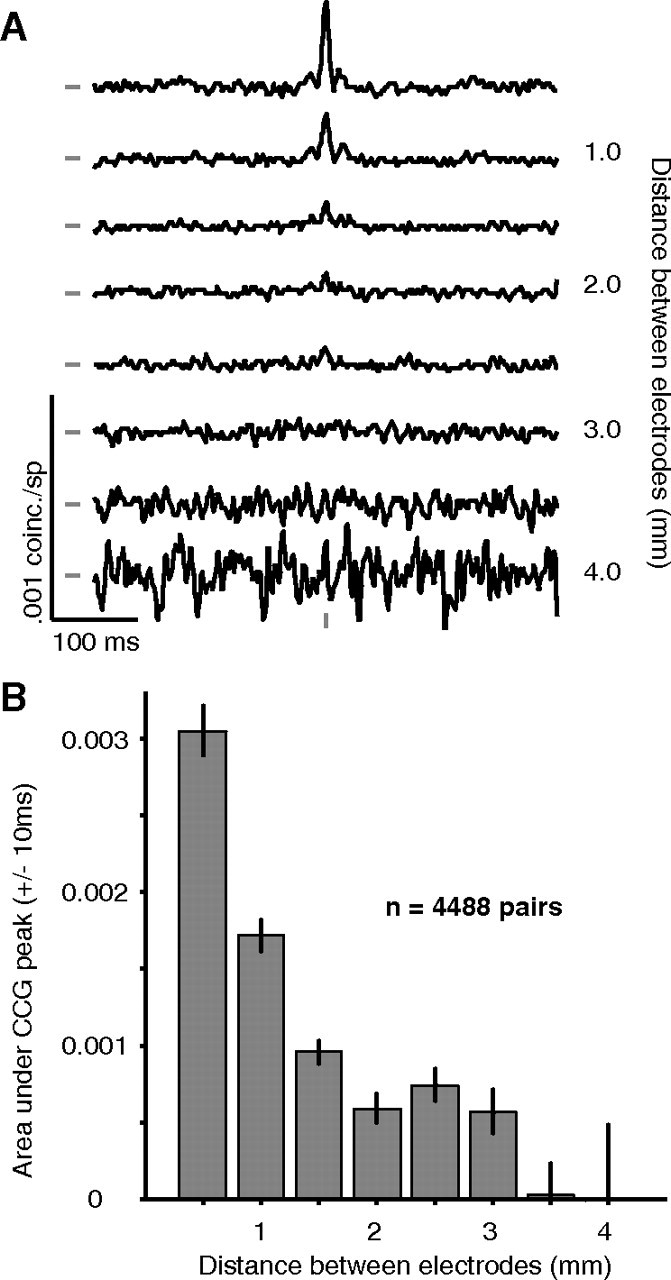
CCGs after removing long time scale correlation. A, Average CCGs, after jitter correction, for pairs of neurons grouped by distance. A large peak, centered on zero time lag, is evident at close distances. The increasing noise in the lower plots is due to the smaller number of pairs at those distances. The tick marks to the left of the CCGs indicate a value of 0 coinc./sp. The tick mark at the bottom of the CCGs indicates zero time lag. B, The area under the CCG peak, within ±10 ms of zero, falls off quickly with distance, reaching zero for pairs >3 mm apart.