
Figure 7.
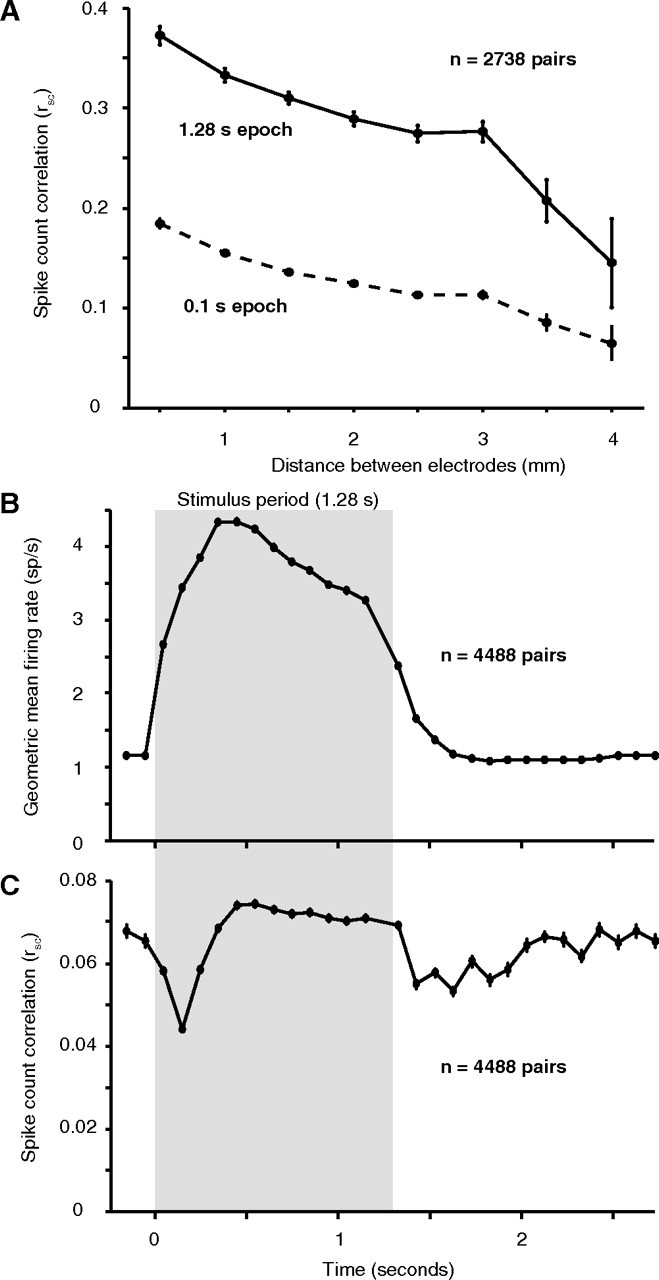
Dynamics of correlation. A, In a separate data collection period in 6 of the 7 array implants, we recorded 15–30 min of spontaneous activity. The value of rsc for 2738 pairs decreased with distance, but was much higher at all distances than during the evoked response. Using a smaller 0.1 s epoch, the same as in B and C, resulted in a lower value for rsc. However, it was still significantly higher than that observed in the ISI after the end of the visual stimulus (C). B, The average geometric mean firing rate across all 12 stimulus directions and all neurons. The stimulus period (1.28 s) is indicated by the gray shaded region, and the nonshaded regions represent the blank interstimulus intervals. Each data point represents the average value for a 100 ms window centered at the time on the abscissa. C, The value of rsc computed in the same 100 ms windows as above.