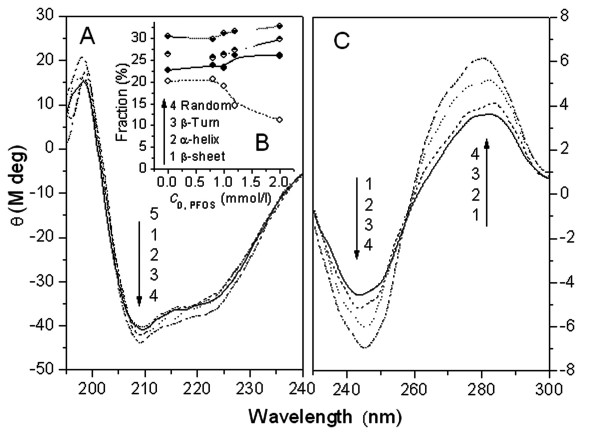
Figure 4.
The molar ellipticity CD curves of solutions containing (A) 0.4 μmol/l SA in the presence of PFOS from 1 to 5: 0, 16, 20, 24, 40 μmol/l and (C) 100 μmol/l DNA with PFOS from 1 to 4: 0, 20, 30, 40 μmol/l; (B) Plot of fraction (%) vs. C0, PFOS for the SA-PFOS solutions. All solutions were prepared at pH7.40.

