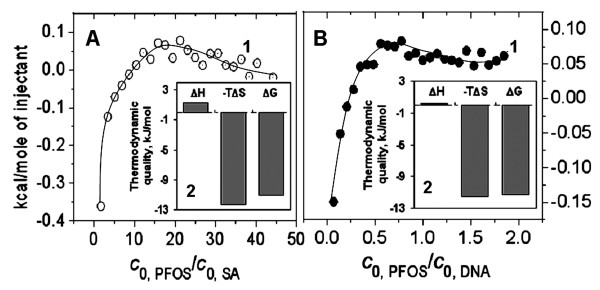
Figure 5.
ITC titration curves of (A) PFOS-SA and (B) PFOS-DNA interactions at pH7.40. The temperature was 37°C. The experiment was conducted by injecting: 2.5 mmol/l PFOS (10 μl every time) into the ITC cell (1.4685 ml) containing (A) 0.01 mmol/l SA or (B) 0.5 mmol/l DNA. The titration profile was integrated and corrected for the heat of dilution, which was estimated by a separate experiment by injecting the PFOS into the B-R buffer. The corrected heat was divided by the moles of injectant, and values were plotted as a function of the PFOS/SA and PFOS/DNA molar ratio. The titration curve was fitted by a nonlinear least squares method.

