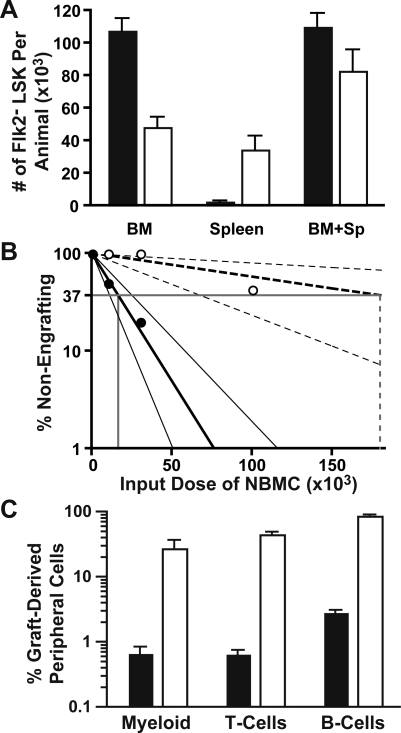
Figure 6. HSC Number and Proliferative Capacity in KrasG12D Mice.
HSCs were analyzed in KrasG12D mice or WT littermates that were treated with pIpC at 21 d of age and then sacrificed at 35 d of age.
(A) Total numbers of Flk2− LSK cells in KrasG12D mice (open bars) or WT mice (filled bars) were quantified by flow cytometry in bone marrow (p < 0.001, t-test) and spleen (p < 0.01); total numbers (spleen + marrow) are also shown (p = 0.12). n = 6 mice per genotype, and error bars show SEM; data are pooled from two independent experiments. Frequencies of Flk2− LSK cells among viable nucleated cells were multiplied by nucleated bone marrow cell counts in femurs and tibias and then scaled to estimate total bone marrow numbers using published distributions [75].
(B) Whole bone marrow from KrasG12D (open circles) or WT littermates (filled circles) was tested for repopulating activity in a limit dilution transplantation assay. The calculated values for frequencies of repopulating units were 1 in 16,610 nucleated bone marrow cells (NMBC) for WT marrow and 1 in 180,404 for KrasG12D marrow. Narrow lines designate 95% confidence intervals (1:7,338 to 1:37,598 for WT and 1:68,953 to 1: 471,998 for KrasG12D; frequencies in WT versus KrasG12D marrow are significantly different with p = 0.0003 by two-tailed t-test). Outcomes of individual experiments are described in Table S1.
(C) Mice that engrafted after transplantation with limiting numbers of whole bone marrow cells (1 × 10⁴ for WT, 1 × 10⁵ for KrasG12D) were bled at 2 mo to determine the percentage of circulating myeloid (Mac1/Gr1+), B-lineage (B220+), and T-lineage (CD3/CD5+) cells that were derived from the transplanted marrow. Filled bars represent mice receiving WT marrow (n = 2), open bars represent mice receiving KrasG12D marrow (n = 3; error bars show SEM; note logarithmic scale).

