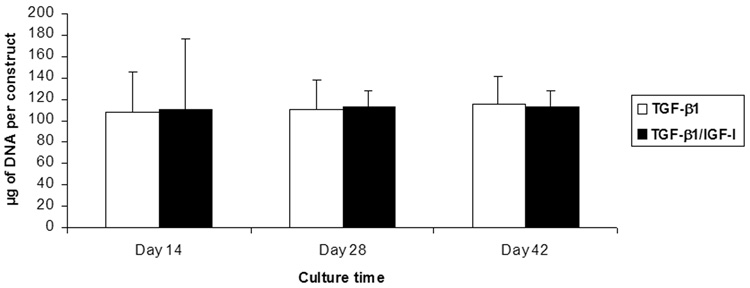
Figure 5.
DNA content of engineered cartilage constructs as a function of culture time. DNA content remained constant, and did not show significant increase over time or between the two growth factor culture conditions (TGF-β1 vs. TGF-β1/IGF-I; p>0.05). The average DNA content per single construct was 108.74±33.96 µg.

