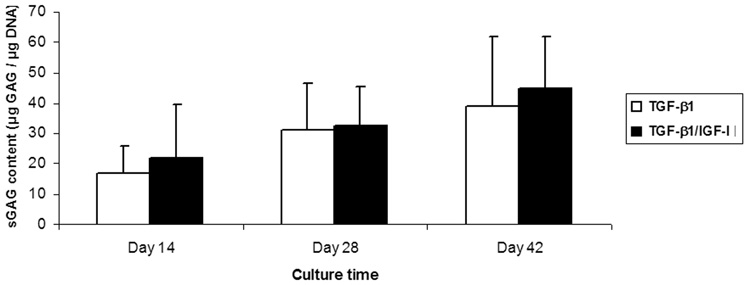
Figure 6.
sGAG content of engineered cartilage constructs as a function of culture time and conditions. In both culture groups (TGF-β1 and TGF-β1/IGF-I), the amount of matrix sGAG changed significantly with time (p<0.01). There was no statistically significant difference in sGAG levels between the two growth factor conditions (p>0.05). Values are mean ± SD (n=6).

