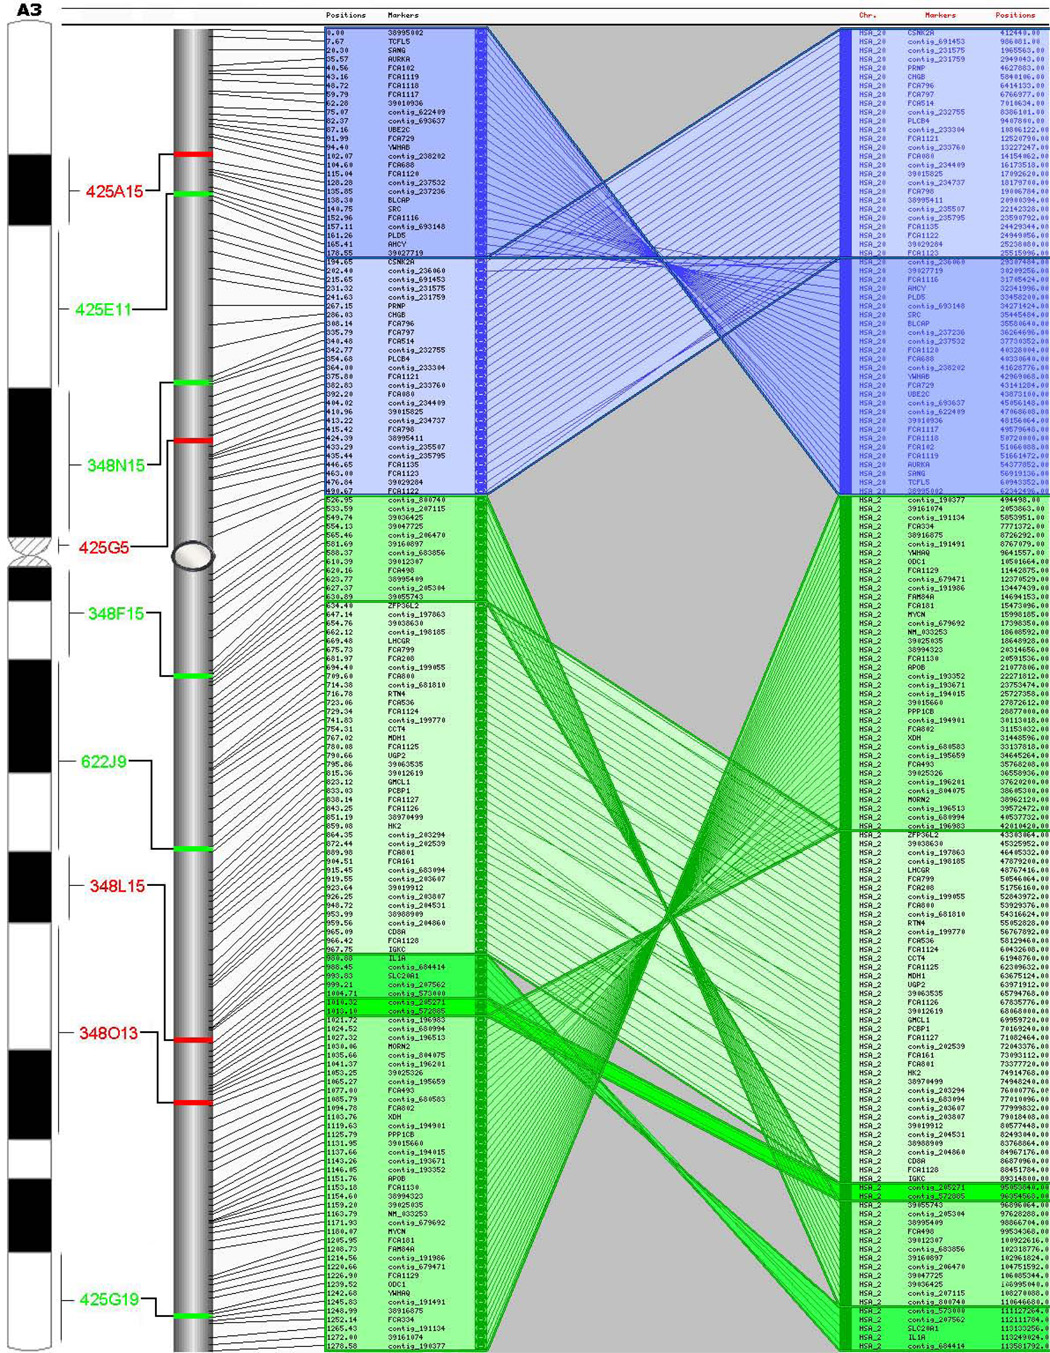
Figure 1.
Integrated RH, FISH, and comparative maps for feline chromosome A3. CSOs for human chromosome 20 and 2 are shown to the right of each cat chromosome map (only the map scale is shown). Inferred centromere positions are shown by gray ovals. Comparative maps represent the output from AutoGRAPH-based analyses.

