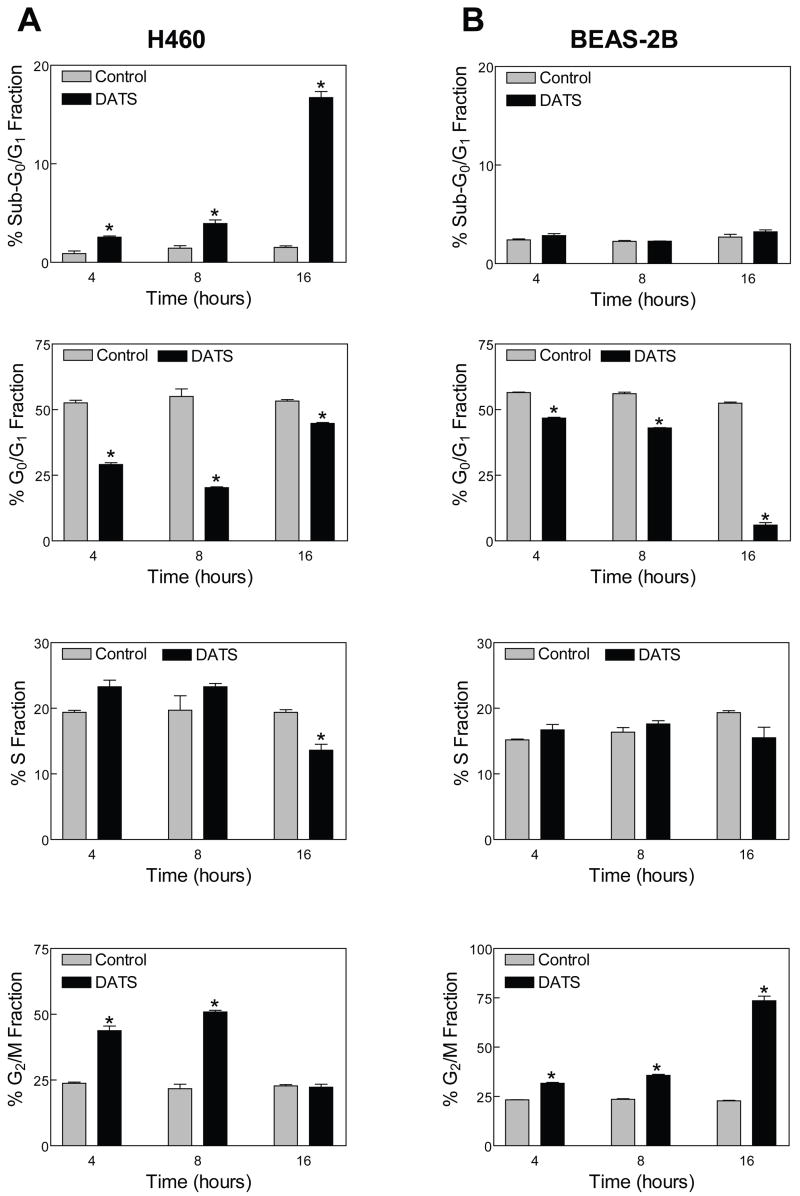
Figure 2.
Cell cycle distribution in H460 (A) and BEAS-2B (B) cells treated with DMSO (final concentration 0.05%) or 40 μM DATS for the indicated time periods. In panels A-B, columns, mean (n= 3); bars, SE. *Significantly different (P<0.05) compared with the corresponding DMSO-treated control by t-test. Similar results were observed in at least 2 independent experiments.

