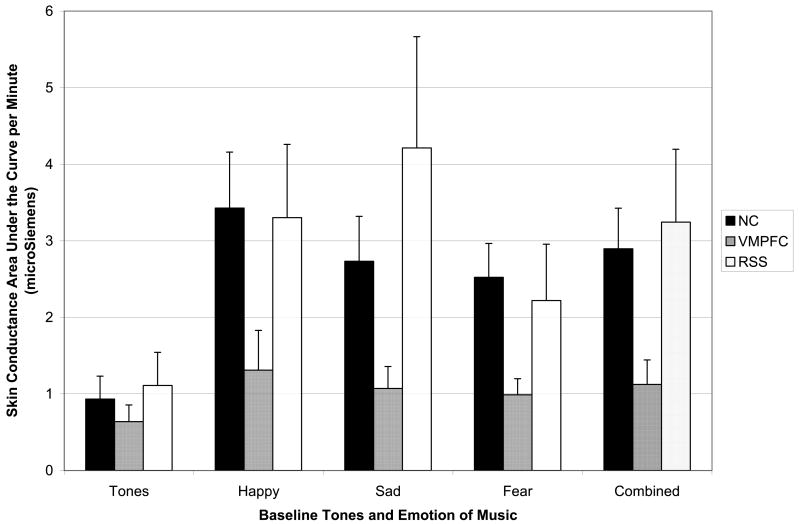
Figure 5. Skin Conductance Response to Music.
Skin conductance area under the curve per Minute (+SE) for happy, sad, fearful, and combined music selections, as a function of subject group (NC, black; VMPFC, dark gray; RSS, light gray). The pattern was the reverse of the experience of emotion findings reported in Figure 3; specifically, the NC and RSS groups were very comparable, while the VMPFC group consistently produced lower skin conductance responses to the emotional music clips, for all three emotion types. The groups were comparable for the baseline neutral tones.

