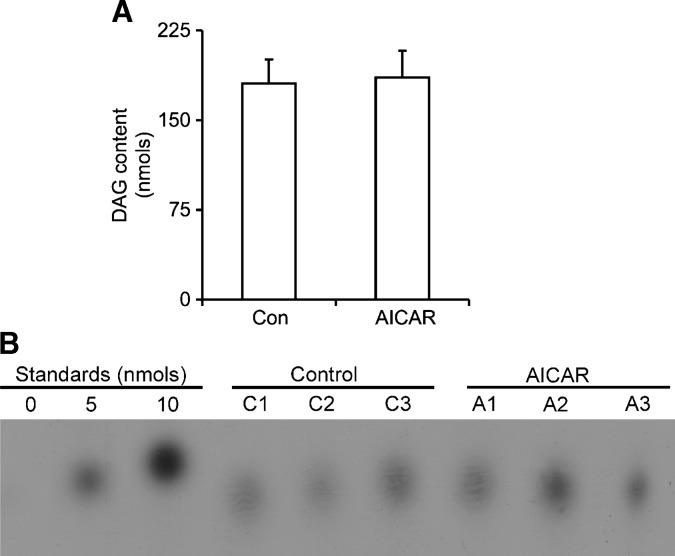
Fig. 6.
Quantification of cellular diacylglycerol (DAG) levels (A) and representative TLC plate visualized by autoradiography (B). Isolated adipocytes were incubated in the absence or presence of AICAR (0.5 mM) for 15 h, and lipids were extracted and subjected to the DAG kinase assay for conversion of DAG into phosphatidic acid. Lipids were separated by TLC, and spots corresponding to phosphatidic acid were scraped off and counted for radioactivity. DAG standards of 0, 5, and 10 nmol were assayed concurrently with samples for absolute quantification. C1–C3 and A1–A3 refer to control and AICAR samples, respectively. Data for DAG quantification are representative of three independent experiments, with n = 9 for each condition. Unpaired t-test was used for statistical analysis. Error bars represent SEM.

