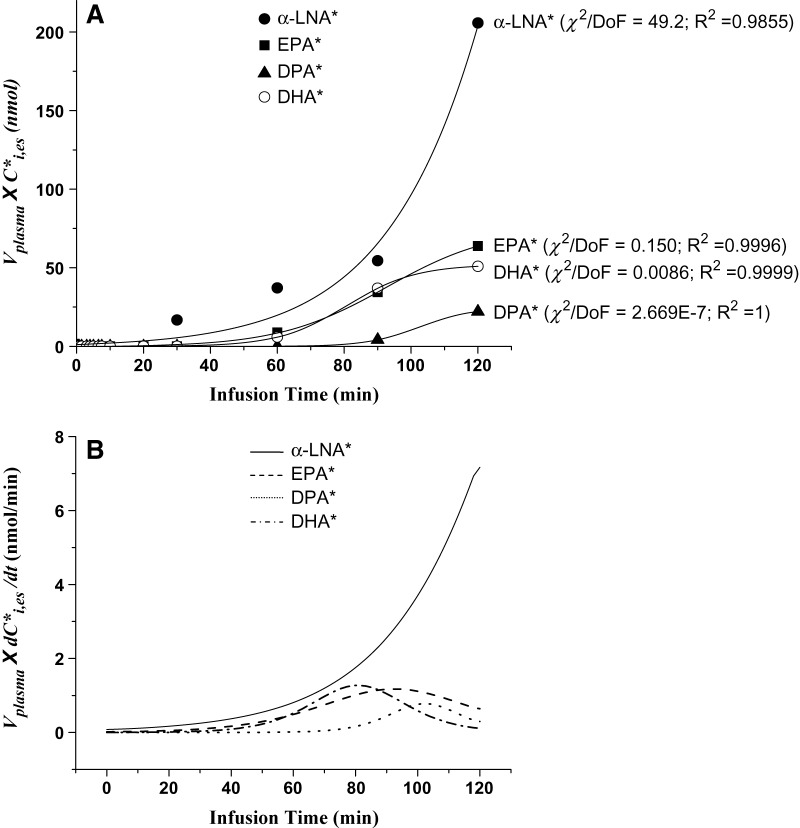
Fig. 4.
A: Labeled n-3 PUFA esterified arterial plasma concentrations × plasma volume plotted against time for experiment in which 3 μmol/100g [13C]α-LNA was infused intravenously for 120 min in a rat, and best-fit sigmoidal curves estimated by Origin using equation 2. B: Curves representing first derivatives of curves in Fig. 4A. * Represents 13C-labeled n-3 PUFAs; χ2, Chi square; DoF, degrees of freedom; R2, coefficient of determination.

