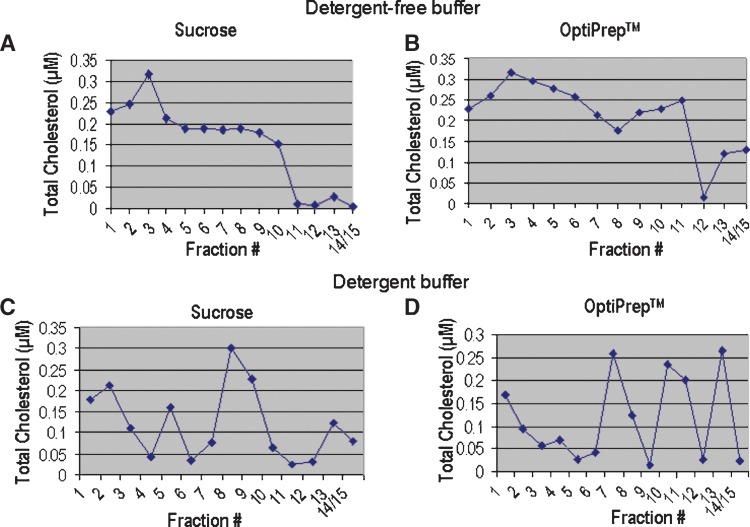
Fig. 2.
Total cholesterol content in fractions isolated with sucrose and Optiprep™ gradients. A: Total cholesterol content of each fraction following lysis with detergent-free buffer and separation along a sucrose gradient. High cholesterol is present in fractions 1–3, suggesting that these fractions are consistent with raft criteria. B: Total cholesterol content of each fraction following lysis with detergent-free buffer and separation along an Optiprep™ gradient. Cholesterol was high in the low (1–3) and mid-density (4–7) fractions. This suggests that it is difficult to determine which are true raft fractions using this method. C: Total cholesterol content of each fraction following separation along a sucrose gradient with 1% Triton-X 100 as the buffer. High cholesterol in fractions 1 and 2 suggest that these may contain DRMs, but high cholesterol in higher density fractions makes this assertion difficult. D: Total cholesterol content of each fraction following separation along an Optiprep™ gradient with 1% Triton-X 100 as the buffer. High cholesterol in fraction 1 suggests the presence of rafts, but higher cholesterol content of high density fractions, again makes this assertion difficult. Total cholesterol is represented in μM concentrations.

