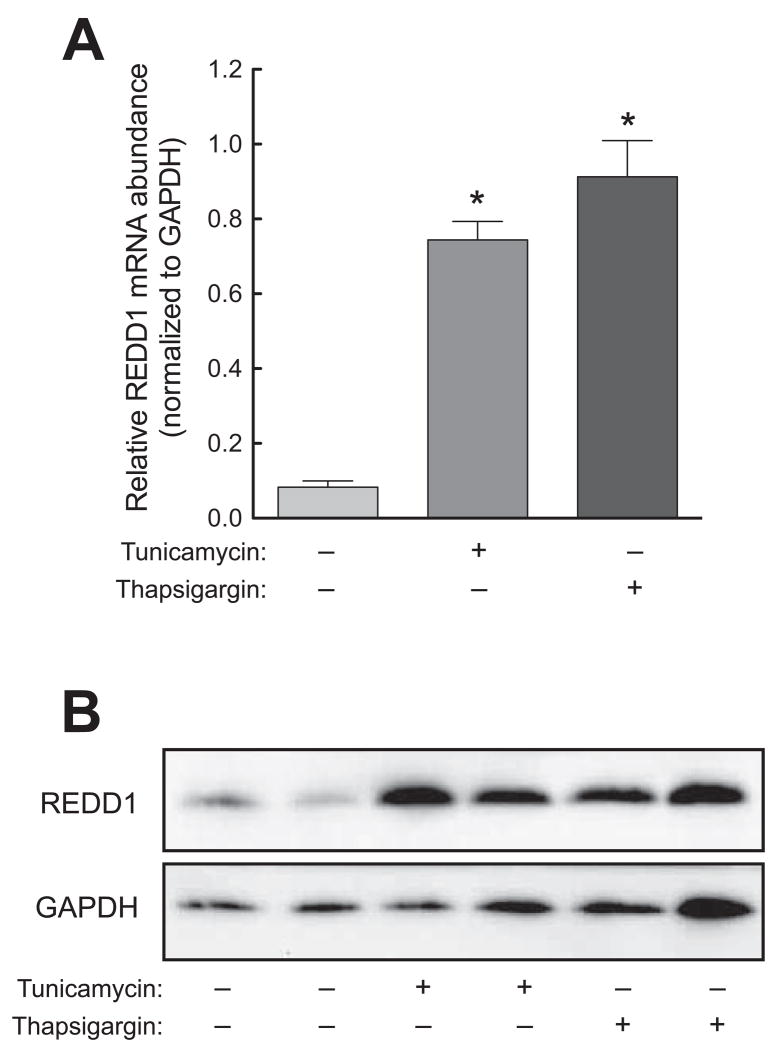
Fig. 1.
ER stress induces REDD1 expression in a liver-derived cell line. HepG2 cells were exposed to 10 μg/ml tunicamycin, 100 nM thapsigargin, or vehicle control in normal growth medium for 4 h. In separate experiments, RNA or protein was prepared from cell lysates and analyzed by qRT-PCR or Western blot respectively. (A) RNA was analyzed for the REDD1 and GAPDH mRNA expression. The results were normalized to GAPDH mRNA and are expressed as means ± SEM (n=3). *p<0.05 vs. control. (B) Western blot analysis using anti-REDD1 (top panel) and anti-GAPDH (bottom panel) antibodies. The results are representative of 3 studies that were performed.

