
Fig. 2.
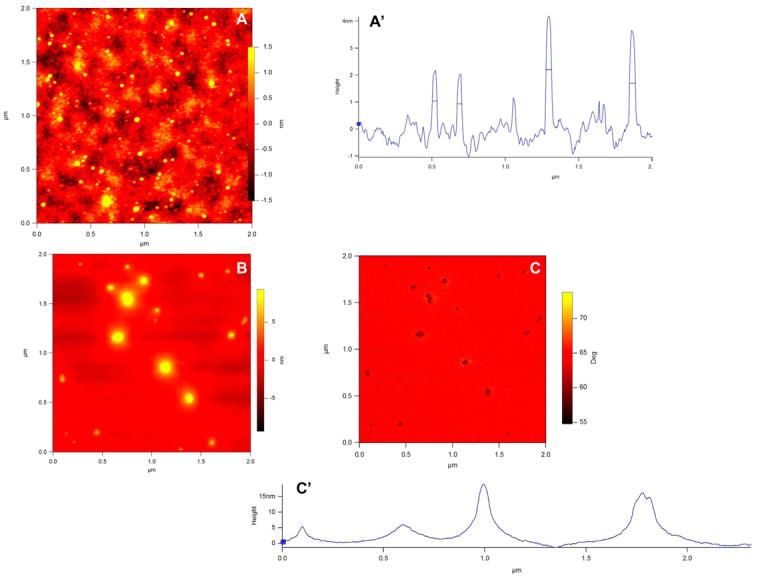

Self –assembly of DMP1 as tracked by AFM imaging in tapping mode: A: Topographic image of the monomeric state of recombinant DMP1. A': Line analysis of A (particle size : ∼ 28.2 ± 1.9 nm; n=15). Images of oligomerized dentin in the presence of 2.5 mM Ca2+ after overnight incubation. B: Topography (particle size varied from 66.63 to 113.6 nm); C: Corresponding phase image. C': Line analysis from B. .D: Topographic image of the monomeric state of the 57 kDa COOH terminal region of native DMP1; (particle size : ∼ 15nm) (E): Topographic image of oligomerization of the 57 kDa COOH-terminal region of native DMP1 in the presence of 2.5 mM Ca2+ after overnight incubation (particle size : ∼38 nm). All images were collected at a resolution of 512×512. Scale bars are 75nm.