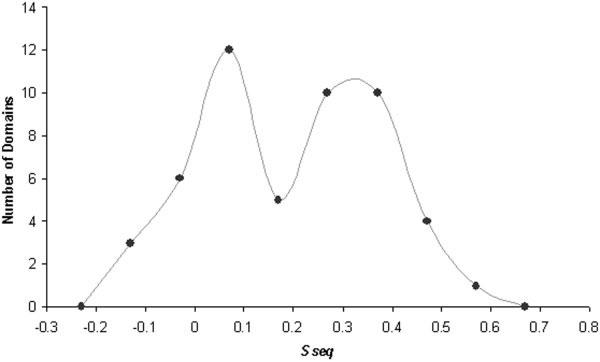
Fig. 3.

Classification of comparative modeling targets: similarity to templates. The numbers of domains that have similarity scores (Sseq) within the indicated bin ranges (x axis) are depicted as closed circles. A smoothed line connects the circles to illustrate the resulting bimodal distribution of the comparative modeling target domains.
