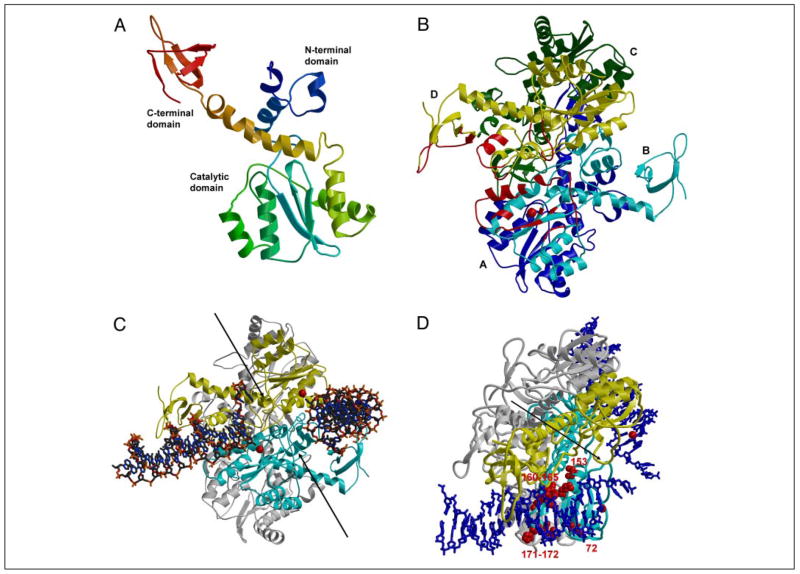
FIGURE 1. HIV-1 IN homotetramer model with bound HIV-1 LTR substrates.
Target DNA is not placed in this model. Bobscript (58) was used to make the figure. A, monomer assembled from N-terminal/core and core/C-terminal structures. The ribbon backbone is colored from blue for the N-terminal domain to red for the C-terminal domain. B, IN tetramer model with subunits A–D colored blue, cyan, green, and yellow, respectively. Only the cyan and yellow subunits are predicted to interact with the two LTRs. The regions of IN predicted to interact with the LTR binding on the left are indicated in red. The red sphere indicates Mg2+at the catalytic site. C, IN tetramer with two LTRs. The view is similar to that in B. The cyan and yellow subunits interact with LTR; the other two subunits are shown in gray. The DNA is in a stick representation, and the red spheres for Mg2+ indicate the two catalytic sites. The two arrows indicate the pair of grooves on the enzyme surface that may be the site of target DNA binding. D, amino acids in IN tetramer involved in determining specificity for the LTR ends. The view of the tetramer is rotated downward relative to panel C to highlight one of the LTR DNA ends. The DNAs are in a blue stick representation. Amino acids involved in determining the specific recognition of one of the two LTR ends are presented in a space-filling model (red). All other notations are as described in C.

