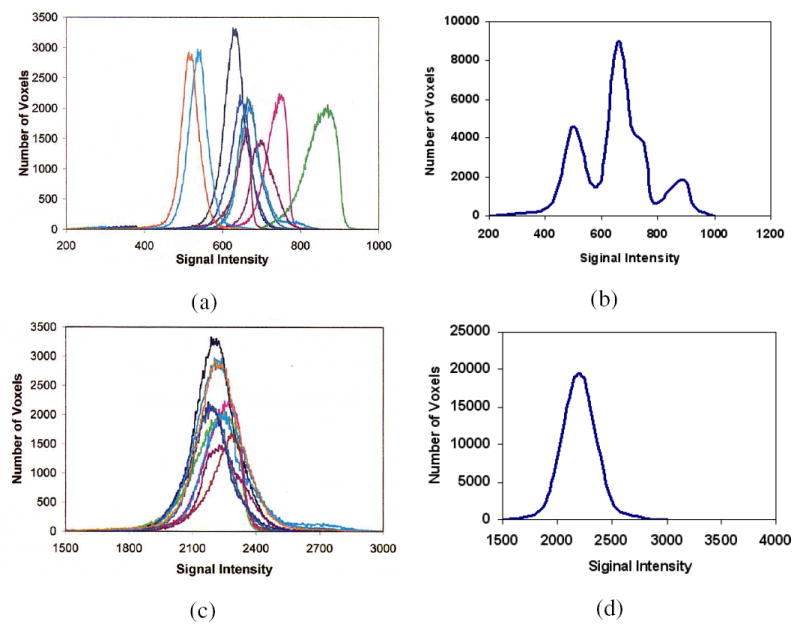
Fig. 1.

(a) Histograms of WM regions in 10 original PD-weighted MRI scenes. (b) A histogram obtained by combining the 10 histograms of (a) which represents WM intensity distribution in PD scenes. (c) Histograms of WM regions in the 10 corresponding standardized scenes. (d) Similar to (b) but obtained from the 10 histograms in (c).
