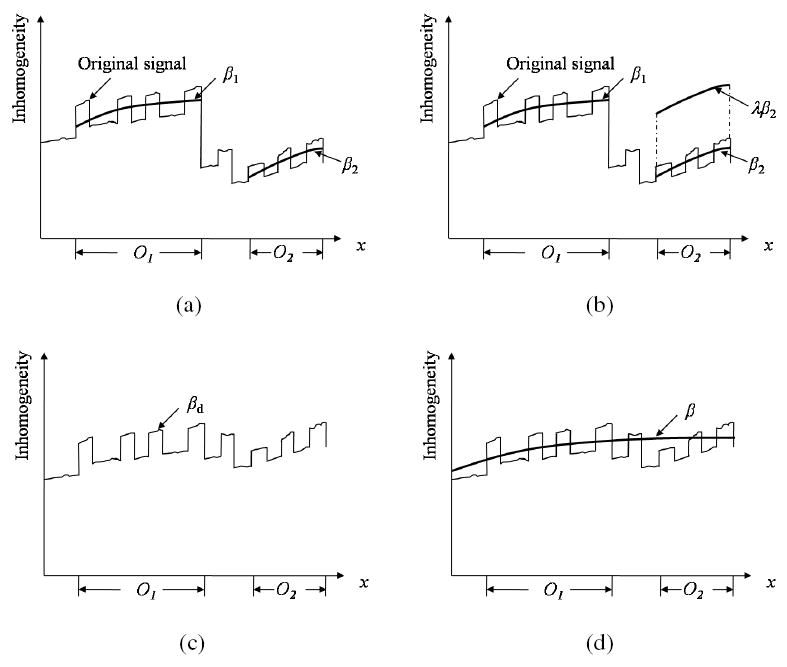
Fig. 4.

Illustration of the possibility of existence of discontinuity between inhomogeneity maps estimated independently from different tissue regions Oi and Oj, and how to combine them into a single unified inhomogeneity map. For the convenience of presentation, the scene is considered to be 1D in this illustration, and only two objects are considered. (a) Original discrete inhomogeneities are estimated independently from different tissue regions, and two smooth inhomogeneity maps β1 and β2 are fitted for two objects O1 and O2 in an independent manner. (b) β2 is shifted by a weight factor λ so that the difference between β1 and λβ2 is minimized. (c) A new discrete inhomogeneity map βd is estimated by combining β1 and λβ2. (d) A single smooth unified inhomogeneity map β is fitted to βd.
