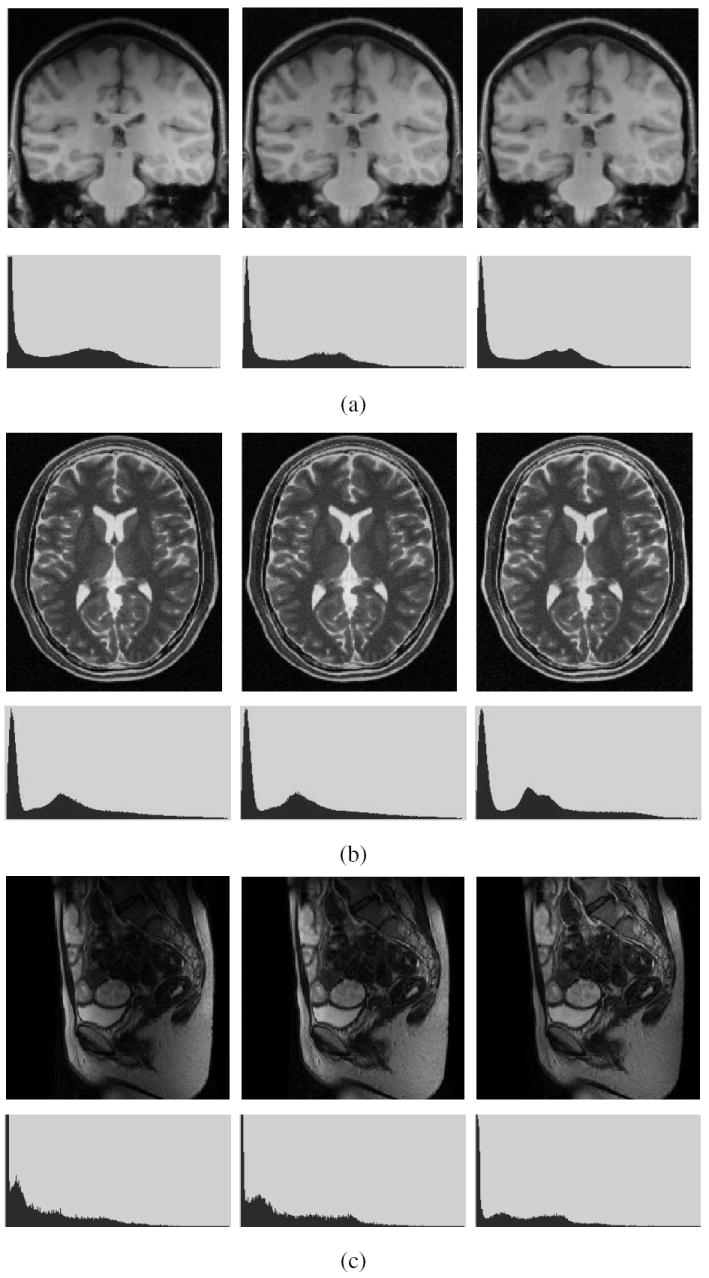
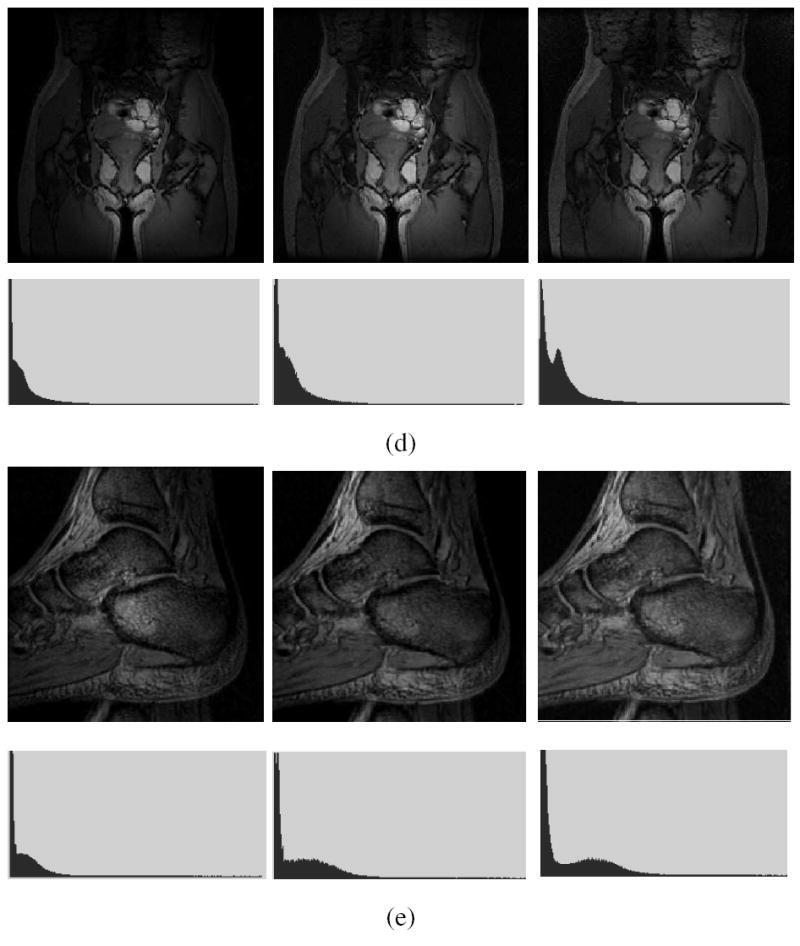
Fig. 5.


A slice of MRI scenes of different body regions acquired by using different MRI protocols is shown on the left in (a) to (e). The corresponding slices of the scenes after inhomogeneity correction by using the N3 (middle) and SBC procedures (right). For each of (a)-(e), the corresponding intensity histogram (of the whole 3D scene) is shown under each scene. The data sets in (a)-(e) correspond to D1-D5 in Table 1.
