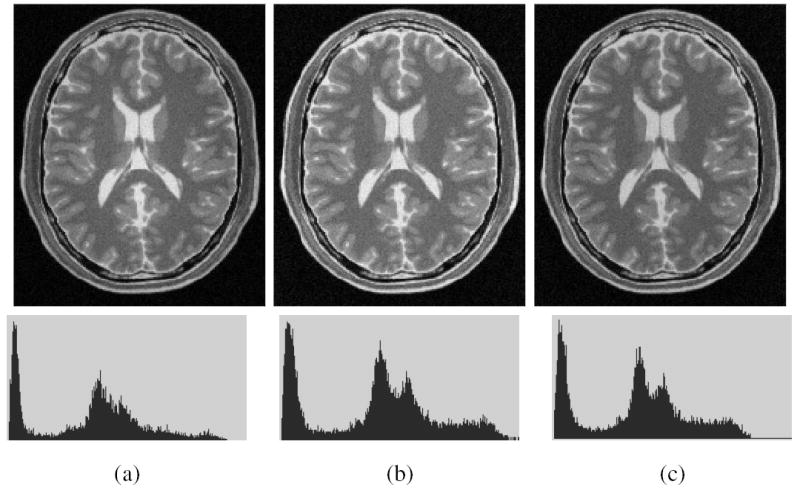
Fig. 6.

(a) A slice of a simulated T2-weighted MRI scene with MS lesions and with 40% inhomogeneity. The corresponding slice of the scene corrected by using (b) N3 method, and (c) SBC method. The scene intensity histograms are shown in the second row.
