
FIG. 4. Analysis of mHtt protein aggregates after in vivo expression of rAAV5-shRNAs.
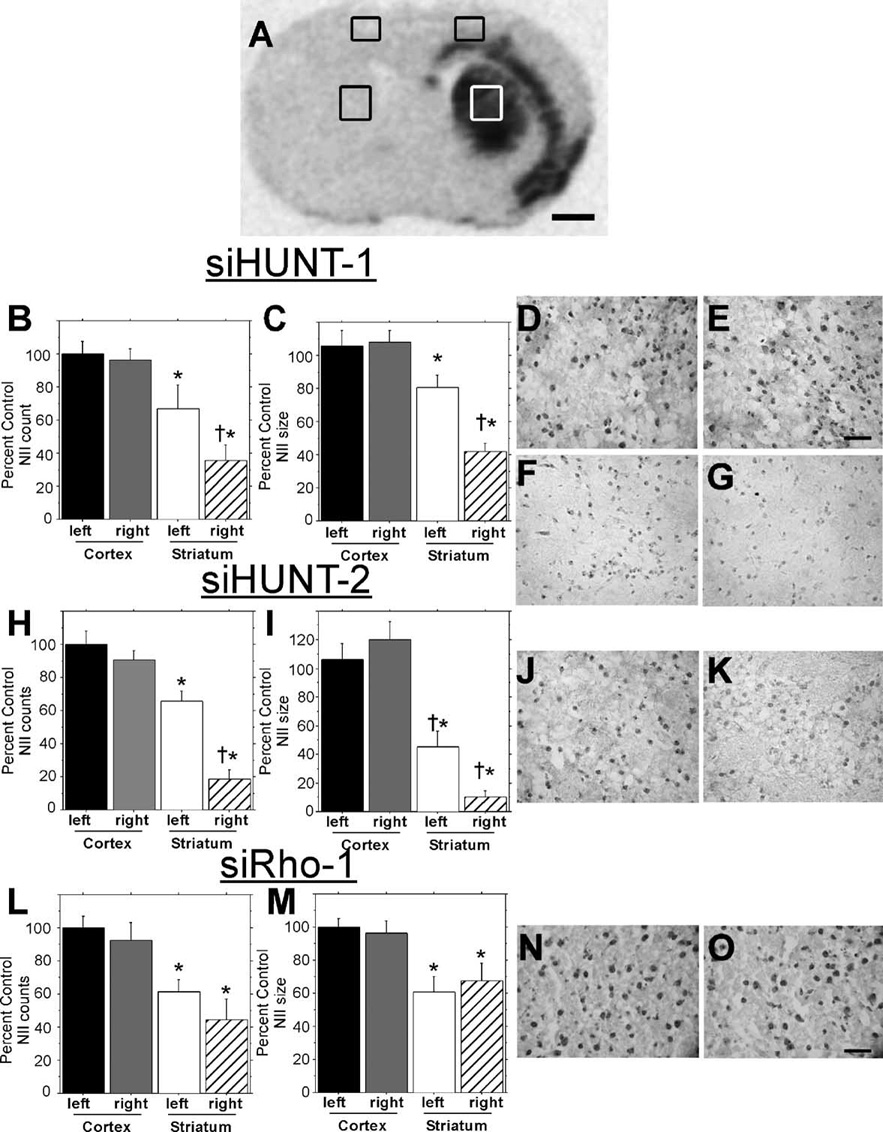
(A) Coronal section from rAAV5-siHunt-1-injected R6/1 mouse processed for in situ hybridization with a probe against vector-specific sequences (as shown in Fig. 3A) showing the areas of Hum-1 staining used for analysis of NII number (B, H, L) and size (C, I, M). Analysis of NIIs in (B–G) siHUNT-1-, (H–K) siHUNT-2-, and (L–O) siRho-1-treated R6/1 mice. Number and size of NIIs (+SEM) are expressed as percentage of left primary motor cortex; the cortex in either hemisphere was not transduced by rAAV and served as a region control (*P < 0.05 compared to left motor cortex; †P < 0.05 compared to left striatum). Photomicrographs of (D) untreated left and (E) siHUNT-1-treated right cortical Hum-1-stained coronal sections from the area shown in the box in (A). Cortical NII size and distribution were similar in siHUNT-2- and siRho-1-treated animals (data not shown). Scale bar, 50 µm, applies to D and E. Representative photomicrographs from the control left striatal area depicted in (A) from (F) rAAV5-siHUNT-1-, (J) siHUNT-2-, and (N) siRho-1-treated mice. Representative photomicrographs from the right striatum of (G) rAAV5-siHUNT-1-, (K) siHUNT-2-, and (O) siRho-1- treated mice. It should be noted that adjacent untransduced striatal areas had Hum-1-positive NII frequency and size that were indistinguishable from those seen in the opposite control striatum. Scale bar, 50 µm, applies to (F, G, J, K, N, and O).