
Figure 2.
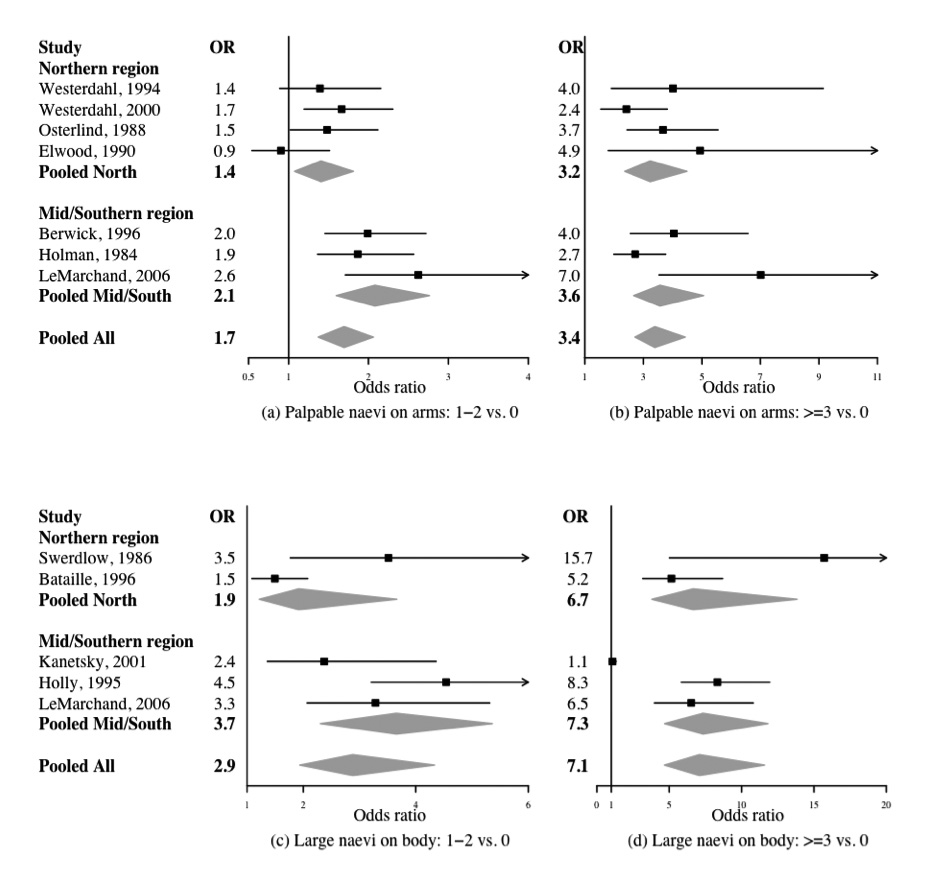
Forest plot of the association between the number of palpable naevi on arms (a) 1–2 versus none, (b) ≥3 versus none and melanoma risks, and the number of large naevi on the whole body (c) 1–2 versus none, (d) ≥3 versus none and melanoma risks. Each line represents results from an individual study with the width of the horizontal line indicating the 95% Bayesian confidence intervals, and the squared box indicating the study-specific OR. Pooled ORs and 95% Bayesian confidence intervals are represented by grey diamond