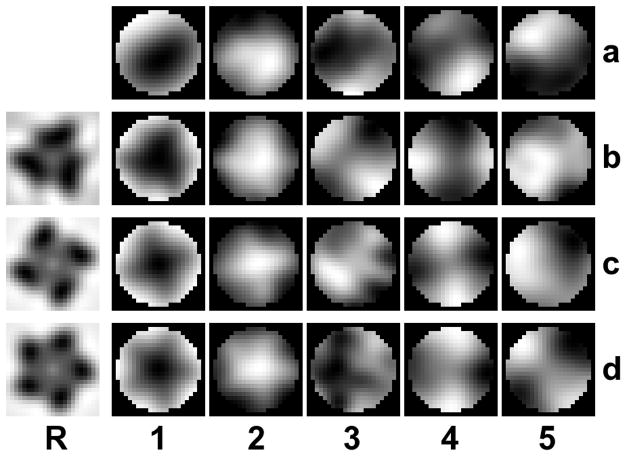
Figure 10. Reference bias in a single reference alignment.
Row (a) shows the first five eigenimages taken from a processing cycle of the SIV data set. An additional single reference alignment is carried out with the artificially created references in column (R) which have 3, 4, and 5-fold symmetry. The aligned subvolumes were then subjected to eigenvalue/eigenvector decomposition. The eigenimages of the data set after the single reference alignment are shown in rows (b – d). The first eigenimage (column 1) and to a lesser extent the second one (column 2) show clearly the symmetry of the reference, indicating an alignment bias towards the chosen reference. All panels represent sections through volumes perpendicular to the spike axis at a level in the head region of the spike.

