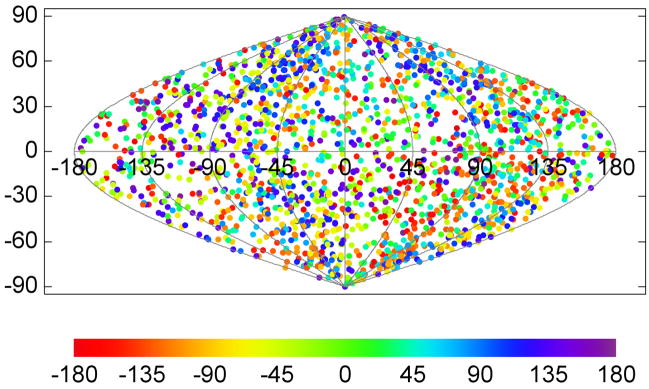
Figure 5. Spatial distribution of the tilt axis direction for the SIV specimen.
The tilt axis direction is calculated with respect to the spike coordinate frame and mapped onto the surface of a unit sphere, which is then converted to a two-dimensional representation with a sinusoidal projection. Latitude 90° (vertical coordinate axis in the plot), for instance, corresponds to a tilt axis direction along the spike axis pointing to the spike head, −90° to the spike leg. Each plotted point indicates the tilt axis direction for a particular spike in the data set and the rotational orientation of the missing wedge relative to the tilt axis is color-coded. A property of the sinusoidal projection is that it preserves the area, so that the density of the plotted points is the same as on the spherical surface. The relatively uniform distribution indicates that the spikes were picked without favoring a particular orientation on the virion surface.

