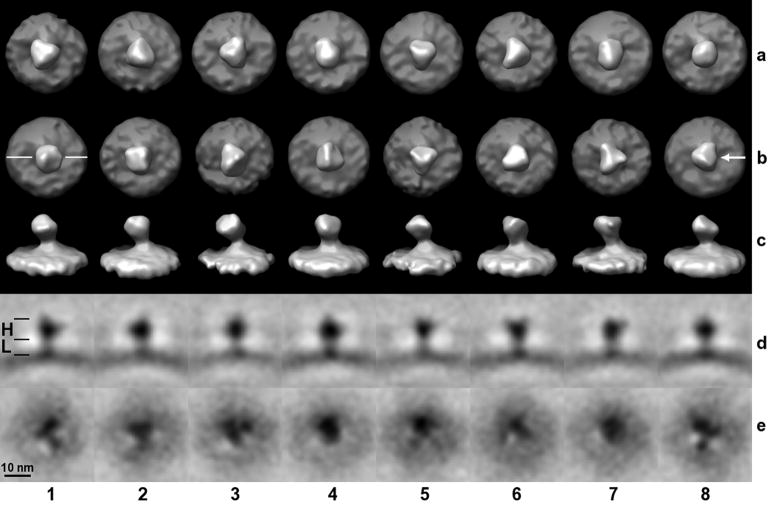
Figure 6. Classification of SIV spikes.
Eight classes were generated (columns 1 – 8). Row (a): The mask used for the multivariate data analysis included the head and leg region of the spike, but not the slightly curved membrane. For rows (b, c, d), the mask included only the head region, for (e) only the leg region. Head (H) and leg (L) regions are marked with black lines in panel (1d). Rows (a, b) are surface rendered top views, (c) are the side views of (b) and the viewing direction with respect to the top view is indicated in panel (8b). In row (d), slices through the volumes of rows (b, c) are shown as gray-scale representations. The orientation of the slicing plane is indicated in panel (1b). Row (e) represent slices through the leg region perpendicular to the spike axis, i. e. slices are parallel to a tangential plane of the curved membrane.

