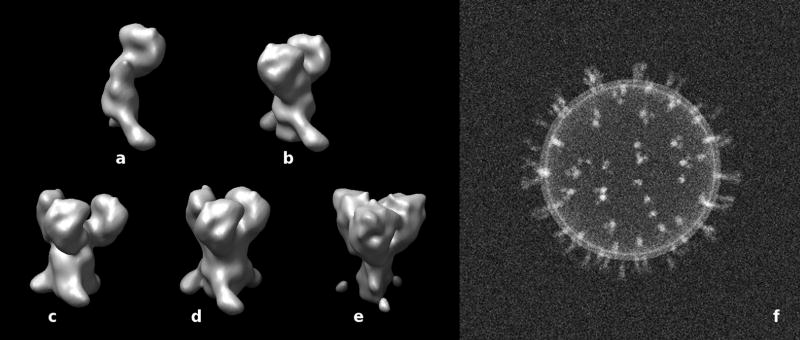
Figure 9. Model calculations.
(a–e) Surface renderings of density maps of artificially created spike structures. It should be noted that these spike structures are not intended to mimic actual spikes faithfully. (a) monomer, (b) dimer, (c, d, e) trimers with different density distributions in the head and leg region. In (c), the subunits in the head region are more widely spaced than in (d), i. e. an offset of 1 nm between the subunits has been applied. (e) was generated with a narrower and less dense leg region. (f) Projection of an assembled phantom using randomly selected maps (a–e) and a spherical vesicle-like structure generated with a lipid bilayer density profile.

