
Fig. 3.
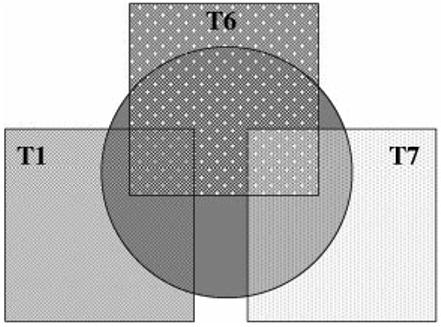
Model generated from logisitic regression analysis suggesting there is one signal associated with disease at this locus. The central grey circle represents the disease signal. The association effects of T1 (T1 box) and T7 (T7 box) are independent of each other but do not account for two separate association signals. T6 (T6 box) shares some of the correlation with disease that exists for T1 and some of the correlation with the disease that exists for T7