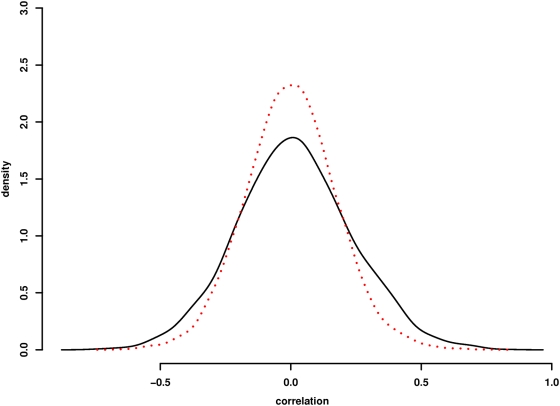
Figure 5. Correlation of gene expression changes with binary protein interactions.
Distribution of transcriptional expression correlations for binary protein interaction pairs in the longevity network is shown in black. Distributions of correlation for randomized binary pairs is shown in red. The experimental network shows enrichment for both positively and negatively correlated binary pairs. Approximate inference via Two-sample Kolmogorov-Smirnov test confirms significant differences in the two distributions of correlations (p<0.00001).

