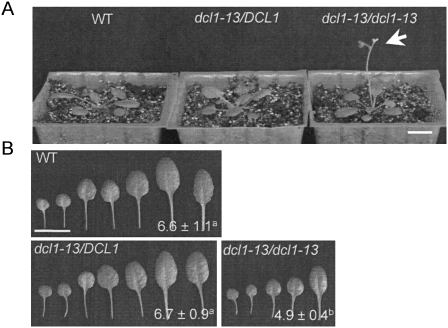
FIGURE 4.
The homozygous dcl1-13 single mutant shows early flowering and decreased number of leaves. (A) Rosette images of WT plants, the heterozygous dcl1-13 mutant (dcl1-13/DCL1) and the homozygous dcl1-13 mutant (dcl1-13/dcl1-13). Bar = 1 cm. The homozygous dcl1-13 shows an early-flowering phenotype (indicated with an arrow). (B) Successive rosette leaves and their numbers (average ± SD) for the plants shown in A. Bar = 1 cm. n = 16–19. Values designated by the same superscript letter are not significantly different at the P = 0.01 level in the t-test.

