FIGURE 5.
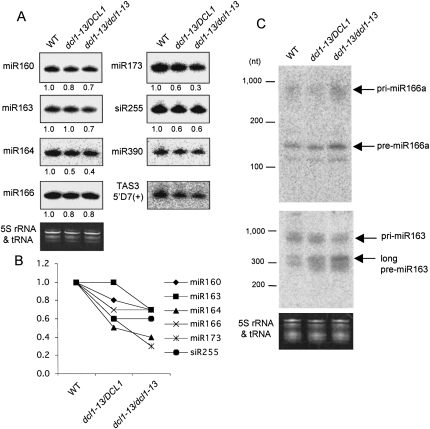
miRNA processing is semidominantly impaired by the dcl1-13 mutation in the presence of HYL1. (A) Northern blot analyses of miRNAs (miR160, 163, 164, 166, 173, and 390) and tasiRNAs (siR255 and TAS3 5′D7[+]) in WT plants and dcl1-13 single mutants. Blots are shown with high contrast in order to make the differences clear. Ethidium bromide staining (5S rRNA and tRNA) is shown as a control. Relative RNA levels estimated from band signal intensities are indicated at the bottom of each lane, with small RNA levels in WT plants set to 1.0. The signals for miR390 and TAS3 5′D7(+) were too weak to calculate the level. (B) The values for miRNAs (miR160, 163, 164, 166, and 173) and tasiRNA (siR255) in A are graphically shown. (C) Northern blot analyses of miRNA precursors for miR166a and miR163 in WT plants and dcl1-13 single mutants. Ethidium bromide staining (5S rRNA and tRNA) is shown as a control. Bands of pri-/pre-miR166a or miR163 are indicated with arrows.

