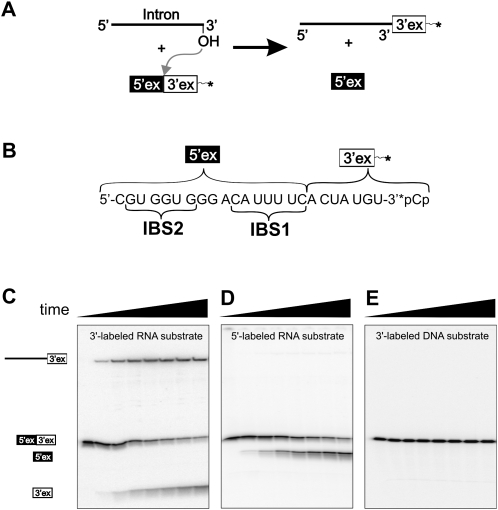
FIGURE 2.
Single turnover reverse-splicing assay. (A) Schematic of the reverse-splicing reaction. (B) Substrate RS1. 5′- And 3′-exonic sections, as well as intron binding sites IBS1 and IBS2, are indicated. (C) Time course (0–30 min) of the reaction between linear intron and 3′-end-labeled RNA substrate RS1. Observable species are indicated on the left side. (D) Time course (0–30 min) of the reaction between 5′-triphosphorylated linear intron and 5′-end-labeled RNA substrate RS1. (E) Time course (0–300 min) of the reaction between linear intron and 3′-end-labeled DNA substrate DS1.

