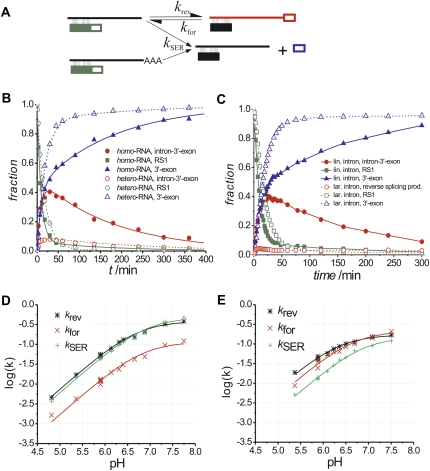
FIGURE 4.
Kinetic investigations. (A) The proposed kinetic model used for data analysis. Linear intron is depicted as a straight line. Intron molecules with untemplated nucleotides at the 3′-end are indicated as a straight line with a stretch of “A.” Full and open boxes show the 5′- and 3′-exons as defined in Figure 1. (B) Kinetic traces from two single turnover experiments, one of which was conducted using homo-RNA (filled symbols, solid lines), the other one with hetero-RNA (open symbols, dashed lines). Symbols show experimental data, the lines represent least-square fits according to the model shown in (A). (C) Progress of reaction by linear intron (filled symbols, solid lines) and lariat intron (open symbols, dashed lines) with 3′-end-labeled substrate RS1. Interpolated lines connect the data points for better visibility. (D) Logarithmic rates obtained for the KCl buffer system as a function of pH. Symbols indicate experimental data, the lines represent best fits using Equation 1. Parameters obtained from the fits are shown in Table 2. (E) Logarithmic rates obtained for the (NH4)2SO4 buffer system as a function of pH.

