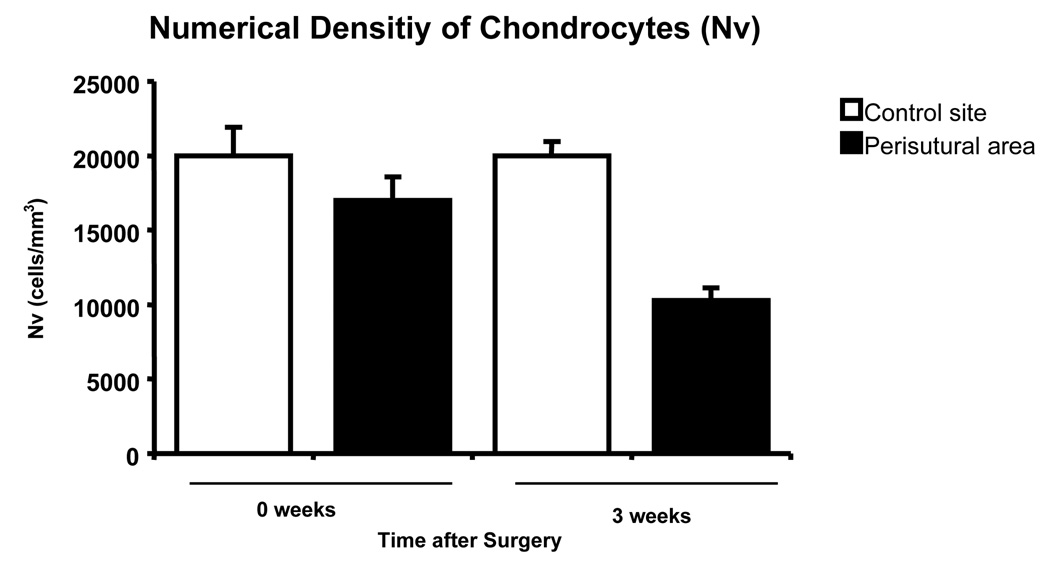
Fig. 7.
Numerical density of chondrocytes in the control site and in the perisutural area 2–3 hours after surgery (0 weeks) and 3 weeks later. Mean values (+ SEM) are represented (n = 8 for each site and for each juncture). The “3-week” values differ significantly from each other (p = 0.0001); the “0-week” ones do not.

