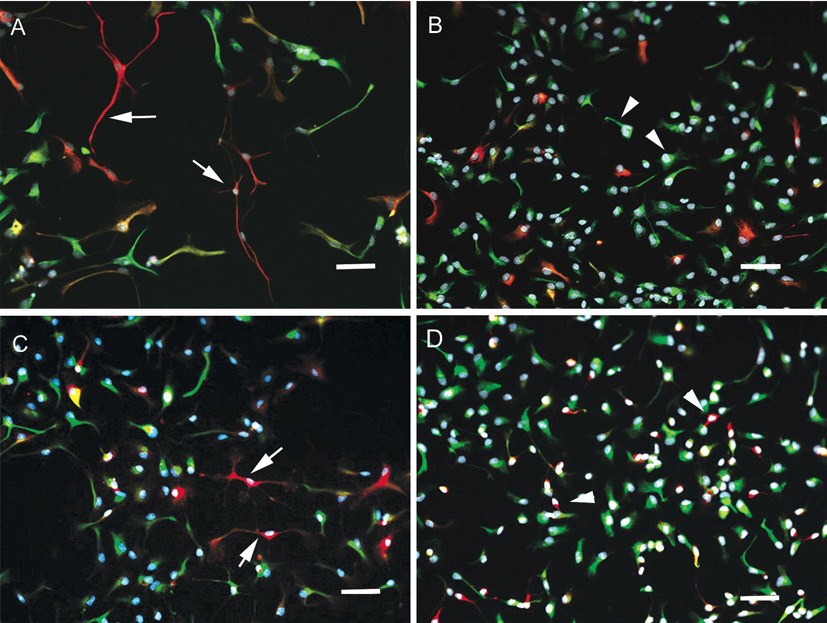
Figure 5.
Influence of BMEC co-culture on NPC morphology. Merged images of NPC that were probed for GFAP (red), nestin (green), and DAPI (blue) (panels A and B) or βIII tubulin (red), nestin (green), and DAPI (blue) (panels B and C). Panels A and C represent differentiation in the presence of BMEC and Panels B and D in the absence of BMEC. Arrows indicate small cell bodies and elongated thin processes (panels A and C) while arrowheads point to larger cell bodies and short processes (panels B and D). Scale bar represents 20 µm.

