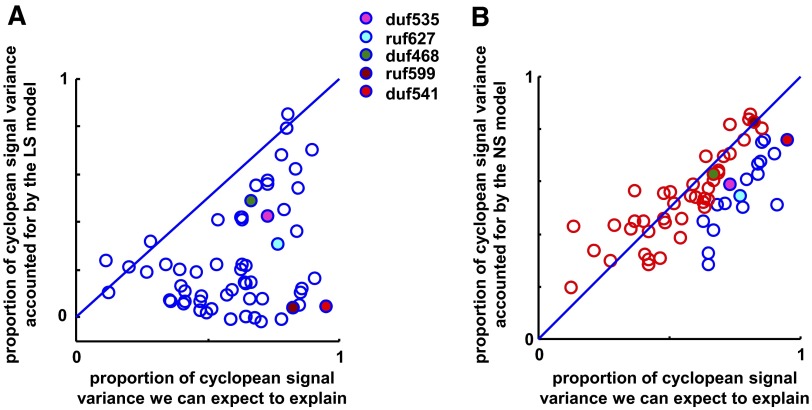
FIG. 10.
Population results, for linear summation (LS) model (A) and NS model (B). Filled points indicate example cells (see legend). See methods for how we calculate cyclopean signal variance and the proportion of variance we can expect to explain. Neurons for which cyclopean enhancement was large relative to variability lie to the right in each plot. In B, red data points indicate individual cells in which a χ2 test revealed no significant deviation from the NS model.

