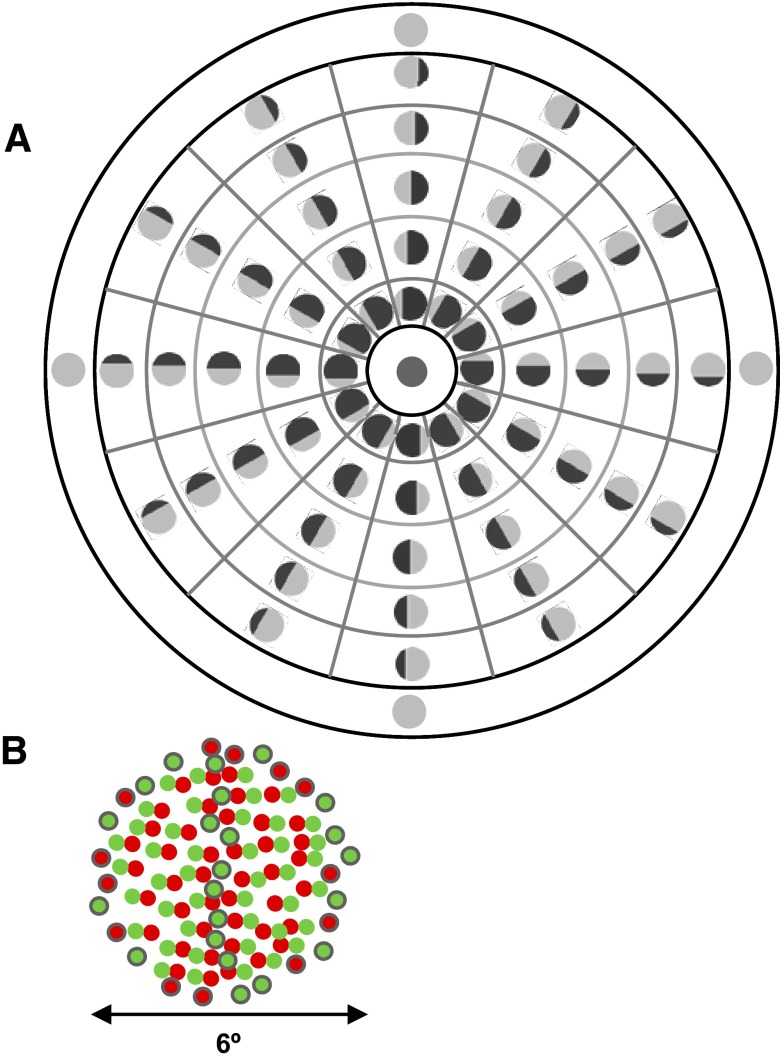
FIG. 2.
Stimulus used to record responses to cyclopean edges. A: polar axes used throughout this study and its predecessor (Bredfeldt and Cumming 2006) to represent edge orientation and position. The icon in each segment shows the corresponding stimulus. B: example of a random-dot stimulus containing a cyclopean edge. Red and green dots represent the inputs to the right and left eyes, respectively. Note that in the left half of the stimulus, green dots are shifted to the left of the red dots, whereas in the right half of the stimulus green dots are shifted to the right half of the stimulus. This creates a disparity-defined vertical edge. Gaps in the stimulus (caused by application of disparity to the dots) were filled with uncorrelated dots, shown here with black outlines. Note that green and red dots are shown here for illustrative purposes. In the actual experiment, all dots were black or white.

