
FIG. 2.
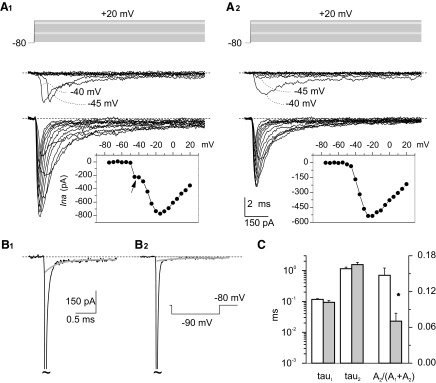
Transient Na+ currents in granule cells in situ. A: properties of I-Nat recorded in 2 typical granule cells (the voltage-clamp protocol is shown at the top). The experimental tracings recorded at –75 to –40 mV and at –35 to +20 mV have been split in 2 different subpanels. A1 provides an example of the currents recorded in group-1 neurons, in which an unclamped and a well-clamped I-Nat component coexist. A2 provides an example of the currents recorded in group-2 neurons, in which the well-clamped I-Nat component was observed in isolation. Insets: the current-voltage (I-V) relationships for I-Nat peak amplitude in the same 2 cells. Note the notch in the I-V relationship of the group-1 cell (arrow). B: capacitive currents (the transient has been truncated: tildes) recorded in the cells illustrated in A1 and A2 (B1 and B2, respectively) in response to a –10-mV voltage pulse from −80 to −90 mV. The decay phase of capacitive transients was fitted with a double-exponential function. Fitting parameters for B1: A1 = −188.6 pA, τ1 = 97.3 μs, A2 = −13.7 pA, τ2 = 0.708 ms, C = −3.2 pA. Fitting parameters for B2: A1 = −195.59 pA, τ1 = 65.8 μs, A2 = −3.4 pA, τ2 = 1.17 ms, C = −1.2 pA. The gray lines correspond to the sum of the slow exponential component plus offset of each fitting. C: average values of fast time constant (τ1), slow time constant (τ2), and relative amplitude coefficient [A2/(A1 + A2)] obtained from exponential fittings of capacitive transients in group-1 cells (white columns; n = 58) and group-2 cells (gray columns; n = 15). Double asterisk: P < 0.003, unpaired t-test).