
FIG. 3.
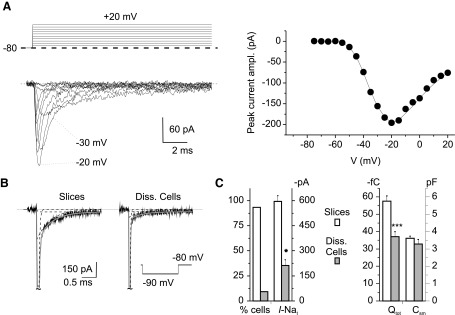
Na+ currents in isolated granule cells. The figure documents how the absence of I-Nat in the majority of acutely dissociated granule cells correlates with a reduction of total membrane but not somatic membrane surface. A: an example of the I-Nat that could be recorded in a minority of acutely dissociated granule cells (n = 3 of 32). The voltage protocol is shown at the top (only sweeps in 10-mV increments are shown). The corresponding I-V relationship is shown on the right. B: examples of the capacitive currents recorded in a representative granule cell in situ and in a representative dissociated granule cell in response to a –10-mV voltage pulse (the transient has been truncated: tildes). The gray line is the double-exponential fitting of the transient's decay phase. The single-exponential functions are shown as dotted lines. Fitting parameters for the group-1 cell recorded in slice: A1 = −260.8 pA, τ1 = 77.5 μs, A2 = −18.5 pA, τ2 = 1.26 ms, C = −1.7 pA. Fitting parameters for the acutely isolated cell: A1 = −420.4 pA, τ1 = 38.6 μs, A2 = −5.0 pA, τ2 = 1.11 ms, C = −1.6 pA. C, left: percentage of cells showing a measurable I-Nat (n = 91 in situ and n = 32 in dissociated granule cells) and maximal peak amplitude of I-Nat, when present, in granule cells in situ (n = 84) and acutely dissociated granule cells (n = 3; *, P < 0.05, unpaired t-test). Right: average total charge transferred with capacitive current transients evoked by –10-mV voltage pulses and somatic capacitance (Csm) in granule cells in situ (n = 83) and acutely dissociated granule cells (n = 32; triple asterisk, P < 0.001, unpaired t-test).