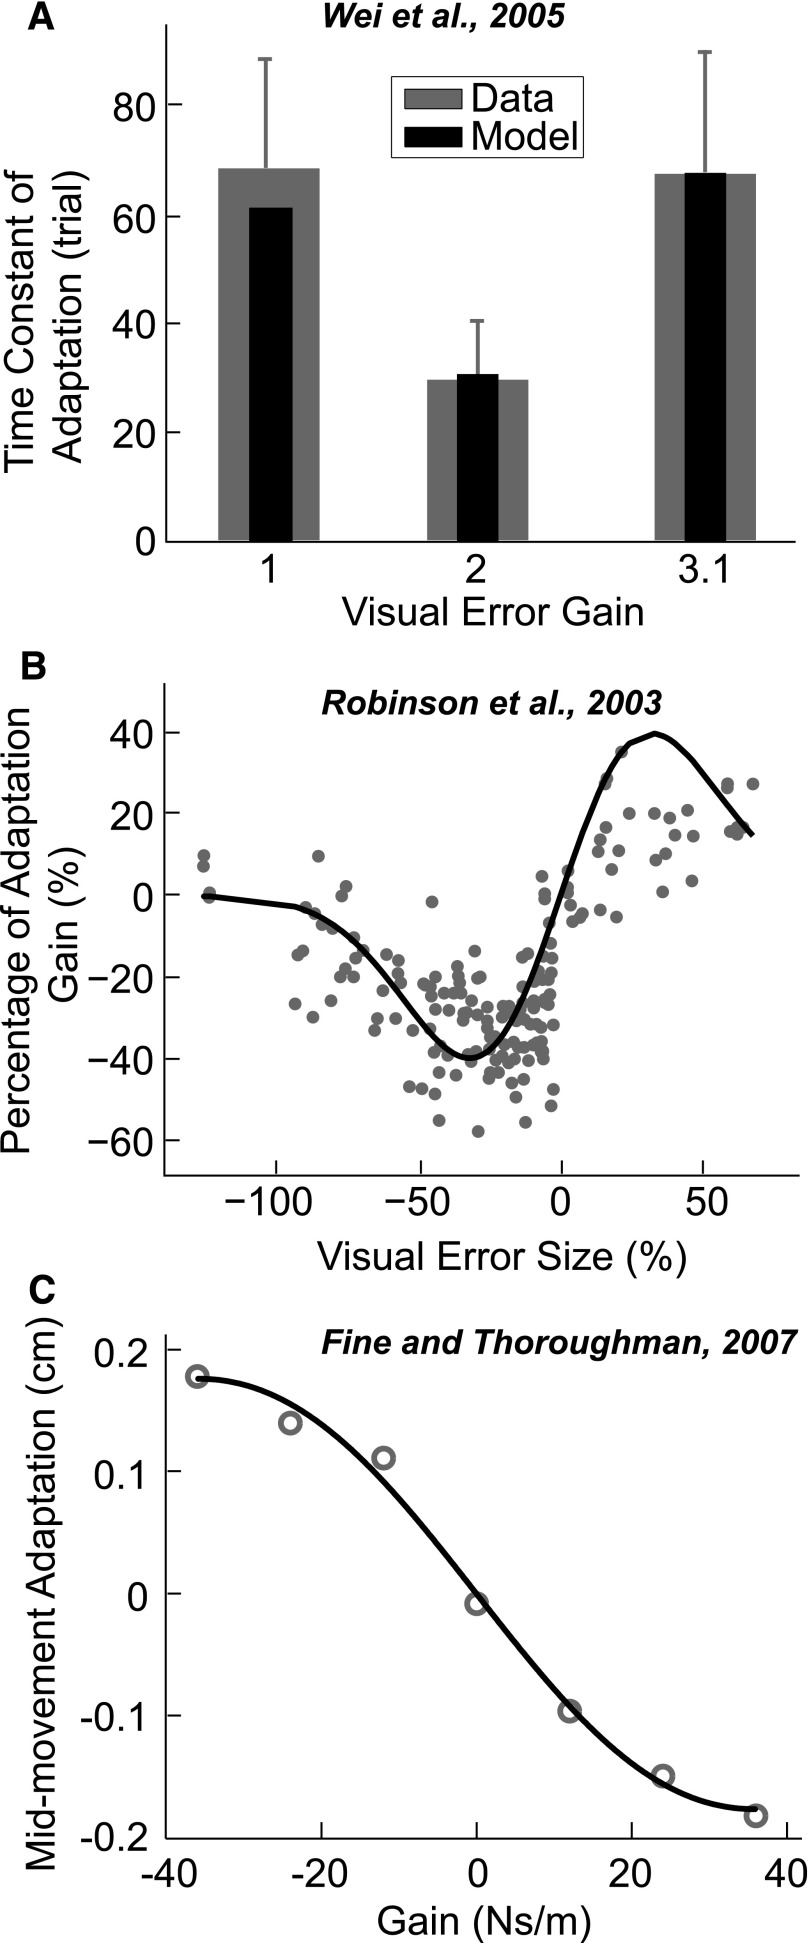
FIG. 5.
Empirical data from three other adaptation studies and the corresponding predictions of the relevance estimation model. A: the study by Wei et al. (2005): the adaptation rate in a visuomotor adaptation task is plotted as a function of visual error gain (gray bars). The black bars denote predictions from the relevance estimation model. B: the study by Robinson et al. (2003): the adaptation gain in saccades is plotted as a function of the visual error size. The line is the prediction from the relevance estimation model. C: the study by Fine and Thoroughman (2007): the amount of adaptation in reaching movements is plotted as a function of the gain of the viscous perturbation. The gray circles are the data from the paper and the black line is the prediction from the relevance estimation model.

