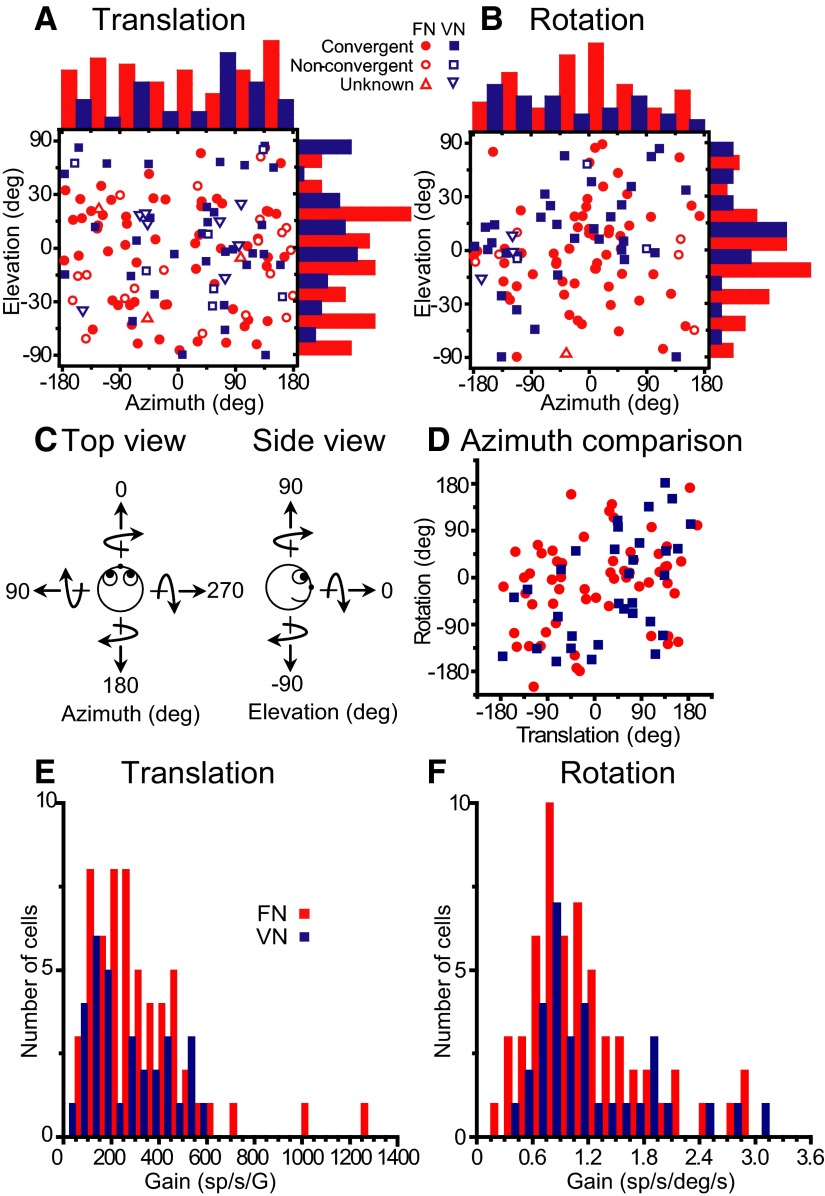
FIG. 2.
Summary of rotation/translation responses in 3D. A and B: distributions of preferred directions (shown in spherical coordinates as azimuth and elevation) during translation and rotation, respectively. Each data point in the scatter plots corresponds to the preferred azimuth (abscissa) and elevation (ordinate) of a single neuron with significant responses along at least 1 motion direction. The data are plotted on Cartesian axes that represent the Lambert cylindrical equal-area projection of the spherical stimulus space (see Gu et al. 2006 for details). Histograms along the top and right sides of each scatter plot show the marginal distributions. Filled symbols indicate cells with significant modulation along at least 1 direction during both rotation and translation (convergent). Open symbols show nonconvergent cells that only modulate during either translation (A) or rotation (B). Cells that were not tested during both rotation and translation are shown with open triangles. C: definition of azimuth and elevation: Top and side view. Straight arrows depict the direction of translation, whereas curved arrows show the direction of rotation around each of the movement axes (based on the right-hand rule). D: scatter plot comparing preferred azimuths for rotation and translation (shown only for convergent cells). For tilt-aligned rotation/translation preferences, data points should fall along the ±90° diagonals (e.g., forward translation is defined with an azimuth of 0°, but a pitch rotation-tilt has an azimuth of 90/270°). E and F: distribution of neural response gains along the 3D preferred direction for translation and rotation, respectively. Fastigial nuclei (FN) neurons, red symbols/bars; VN neurons, blue symbols/bars.

