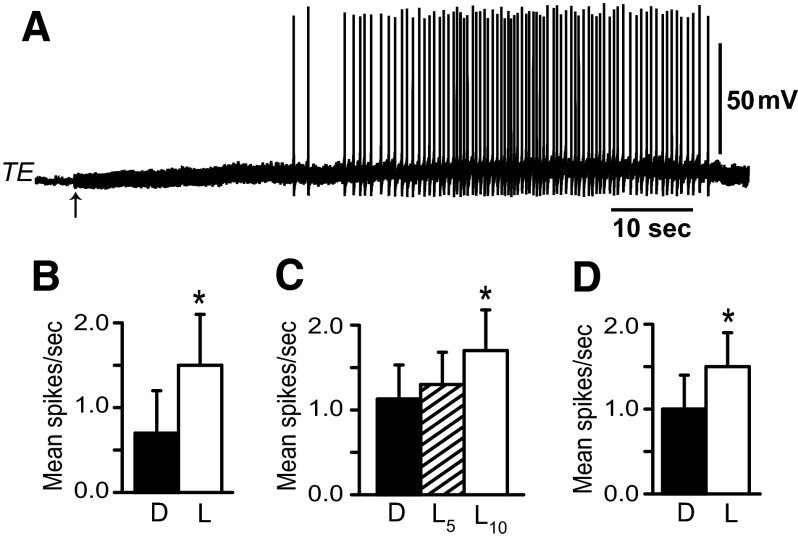
FIG. 8.
A: recording from a tail extension (TE) efferent neuron showing an increase in spike activity elicited by light-attenuated 1 log unit. The arrow indicates the onset of light. B: group data of mean spike activity recorded from tail extension efferent neurons (n = 5) immediately before light onset (D) and during the presentation of light-attenuated 1 log unit (L); *P < 0.025. C: group data of mean spike activity recorded from lateral foot contractile (LFC) efferent neurons (n = 10) averaged from two 5-s epochs in the dark (D) immediately preceding light onset, average spike activity recorded during the first 5-s epoch in light (L5), and the second 5-s epoch in light (L10). Illumination of the photoreceptors elicited an “on” response in LFC efferent neurons. Light-attenuated 1 log unit from maximum intensity; *P < 0.05. D: group data depicting mean spike activity of LFC efferent neurons (n = 10) in the dark before light onset (D) and during a 2-min presentation of light-attenuated 1 log unit; *P < 0.025.

