
Table 1.
Comparison of the active site geometry of camphor complexes of P450cam, P450cam*, and C357U P450cam* determined from monoclinic crystals using the same refinement procedure
| Complex (PDB code) | Space group Unit cell (a, b, c) ÅMolecules per asymmetric unit | Resolution, Å | RMSD */native, Å | Coord. error†, Å | Distance, Å |
||||
|---|---|---|---|---|---|---|---|---|---|
| a | b | c | d | ||||||
| Native ferric P450cam (1dz4) | P2167.4, 62.7, 95.5, β = 90.65° | 1.60 | na | 0.09 | 2.38 | 3.5 | 3.3 | 3.3 | 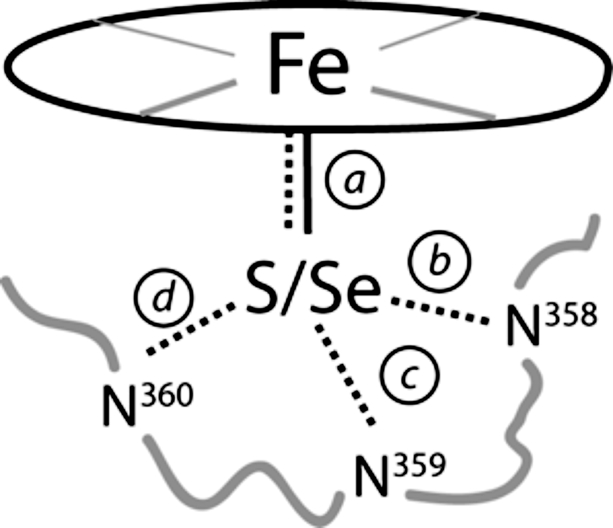 |
| 2.34 | 3.5 | 3.3 | 3.3 | ||||||
| 2 | |||||||||
| P450cam*(3fwg) | P21 67.2, 62.8, 95.6, β = 90.53° | 1.55 | 0.18 | 0.09 | 2.39 | 3.5 | 3.2 | 3.3 | |
| 0.17 | 2.34 | 3.5 | 3.2 | 3.4 | |||||
| 2 | |||||||||
| C357U P450cam*(3fwf) | P21 67.5, 61.9, 94.5, β = 90.80° | 1.83 | 0.26 | 0.13 | 2.47 | 3.5 | 3.3 | 3.6 | |
| 0.26 | 2.47 | 3.5 | 3.3 | 3.6 | |||||
| 2 | |||||||||
na, not applicable.
†Estimated coordinate (Coord.) error based on R-/Rfree value.