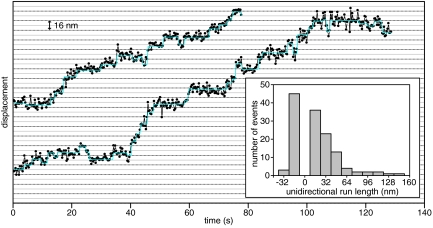
Fig. 3.
High spatial precision measurements of dynactin movement along MTs. Gaussian fits of the position of moving dynein–dynactin-TMR spots at each point in time are displayed as black circles connected by lines, and steps extracted from these fits are displayed as cyan lines. Horizontal lines are separated by 8 nm. (Inset) Histogram of the length of unidirectional segments (distance traveled before a ≥8-nm reversal) of dynein–dynactin movment.

