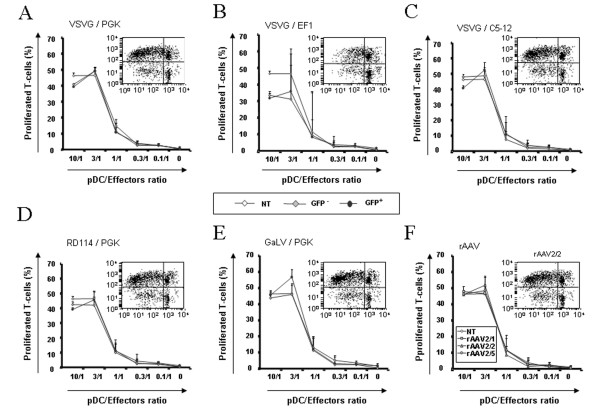
Figure 6.
T-cell stimulatory capacity of non-transduced and transduced GEN2.2 in mixed lymphocyte alloreactions. Day 5 transduced GEN2.2 were matured in CpG for 24 hours, before cell sorting on an E-GFP expression basis. (A-E) Total non-transduced (NT), E-GFP- and E-GFP+cell sorted GEN2.2 transduced by the same LV as those described in figure 3 were incubated with allogeneic T cells stained with CFSE. (F) Total non-transduced (NT) and rAAV2/1, rAAV2/2 or rAAV2/5 transduced unsorted GEN2.2 were incubated with allogeneic T-cells stained with CFSE. After 4 days of co-culture, percentages of CD3+ dividing T cells measured by flow cytometry were linearly correlated with the loss of CFSE fluorescence. Dot plots inserted in graphs show one representative CFSE profile at the ratio 3/1 for GFP+ cells. The data are shown as the means of 3 independent experiments.

